Overview
AeroFlyway (v0.6.0) is an open-source program built to help ornithologists, wildlife planners, educators, and community observers visualize and investigate nighttime bird migration. Every spring and autumn, billions of songbirds cross dark skies between wintering and breeding grounds, navigating through shifting winds and past brightly lit cities that can disorient flocks and draw them toward glass facades. Until now, studying this hazard meant juggling separate tools for weather radar tables, rooftop audio recordings, and city light maps. AeroFlyway unifies all three inside a fast, offline desktop and command-line program: an agent-based flight and light-pollution simulator, a weather-radar vertical profile reader, and a nighttime flight-call acoustic classifier. Across an Atlantic flyway scenario with 1,000 virtual migrants, dimming urban skyglow by 80% lowered collision risk by 94.4% (cutting strikes from 35 to 1). On Mid-Atlantic weather radar records, the reader separated clutter from migration traffic peaking over Dover, Delaware at 1,507.7 birds/km/hr near 600 m altitude, while acoustic filtering separated high-pitched warbler calls (7.324 kHz) from lower thrush calls (3.461 kHz). Source code, documentation, and companion apps are listed at https://crvscience.com/apps.
1. Real-World Context & Why This Problem Matters
The Scale and Mystery of Nocturnal Bird Migration
Twice each year, an immense river of wildlife passes silently overhead while most people are asleep. Across North America alone, more than four billion birds migrate north in spring and south again in autumn, and roughly four out of five songbird species make their long-distance flights under the cover of darkness[1]. Flying at night solves several physical and biological challenges at once. Nocturnal air is cooler, denser, and far calmer than daytime air heated by the sun, which lowers aerodynamic drag and reduces dangerous overheating during hours of continuous flapping. Traveling after sunset also shields small songbirds—warblers, thrushes, sparrows, and vireos—from daytime aerial predators such as hawks and falcons while preserving daylight hours for resting and rebuilding vital fat reserves along stopover habitats.
For tens of millions of years, nocturnal migrants navigated reliably using star patterns turning around the celestial pole, Earth's magnetic field, sunset polarization cues, and coastal landforms. Over the past century, however, rapidly expanding cities placed bright domes of artificial skyglow and illuminated glass towers directly beneath major coastal and inland flyways[3]. When low clouds, drizzle, or coastal fog hide natural horizon and stellar cues, intense upward and horizontal illumination disrupts avian orientation. Instead of cruising harmlessly high above city skylines, disoriented flocks descend into illuminated urban canyons, circle bright structures until exhausted, or strike reflective glass panes at pre-dawn descent[3].
Why Researchers Need Radar, Sound, and Simulation Together
Measuring and reducing this seasonal hazard requires answering three everyday scientific questions together: how many birds are moving aloft and at what altitude, which broad bird families are calling overhead, and how municipal dimming schedules alter fatal collision rates on peak nights. Traditionally, each question belongs to a separate specialty using incompatible file formats. Meteorologists and aeroecologists inspect Vertical Profile Time Series (VPTS) generated by coastal Doppler weather radar installations, separating biological reflections from passing rain or spinning wind turbines once static ground echoes are stripped away[2]. Field biologists mount weatherproof microphones on rooftops to record short nighttime flight calls, then spend hours sorting spectrograms manually to separate thrushes from warblers.
Conservation liaisons and city sustainability teams run risk projections to determine when voluntary "Lights Out" advisories deliver maximum protection without shutting down essential street safety lighting. Because radar tables, audio recordings, and individual flight simulations rarely connect smoothly inside one tool, local planners, students, and ornithology volunteers face steep technical friction. AeroFlyway bridges all three lenses cleanly inside a single offline Rust desktop and terminal application.
2. Conceptual Design & How AeroFlyway Works
Bridging Real-World Observations and Interactive Modeling
AeroFlyway (v0.6.0) executes natively on standard laptops without cloud accounts, web latency, or expensive proprietary mapping subscriptions. Users launch either a guided terminal workflow (cli.rs and main.rs) or a graphical desktop map window rendering coastline geometry and corridor overlays cleanly (basemap.rs and map_engine.rs). Every processed night survey or dimming scenario stores durably inside a portable local SQLite archive (db.rs) and exports clean comma-separated spreadsheets and GeoJSON boundary layers (export.rs) ready for municipal sustainability dashboards and classroom notebooks.
How Each Subsystem Processes Data
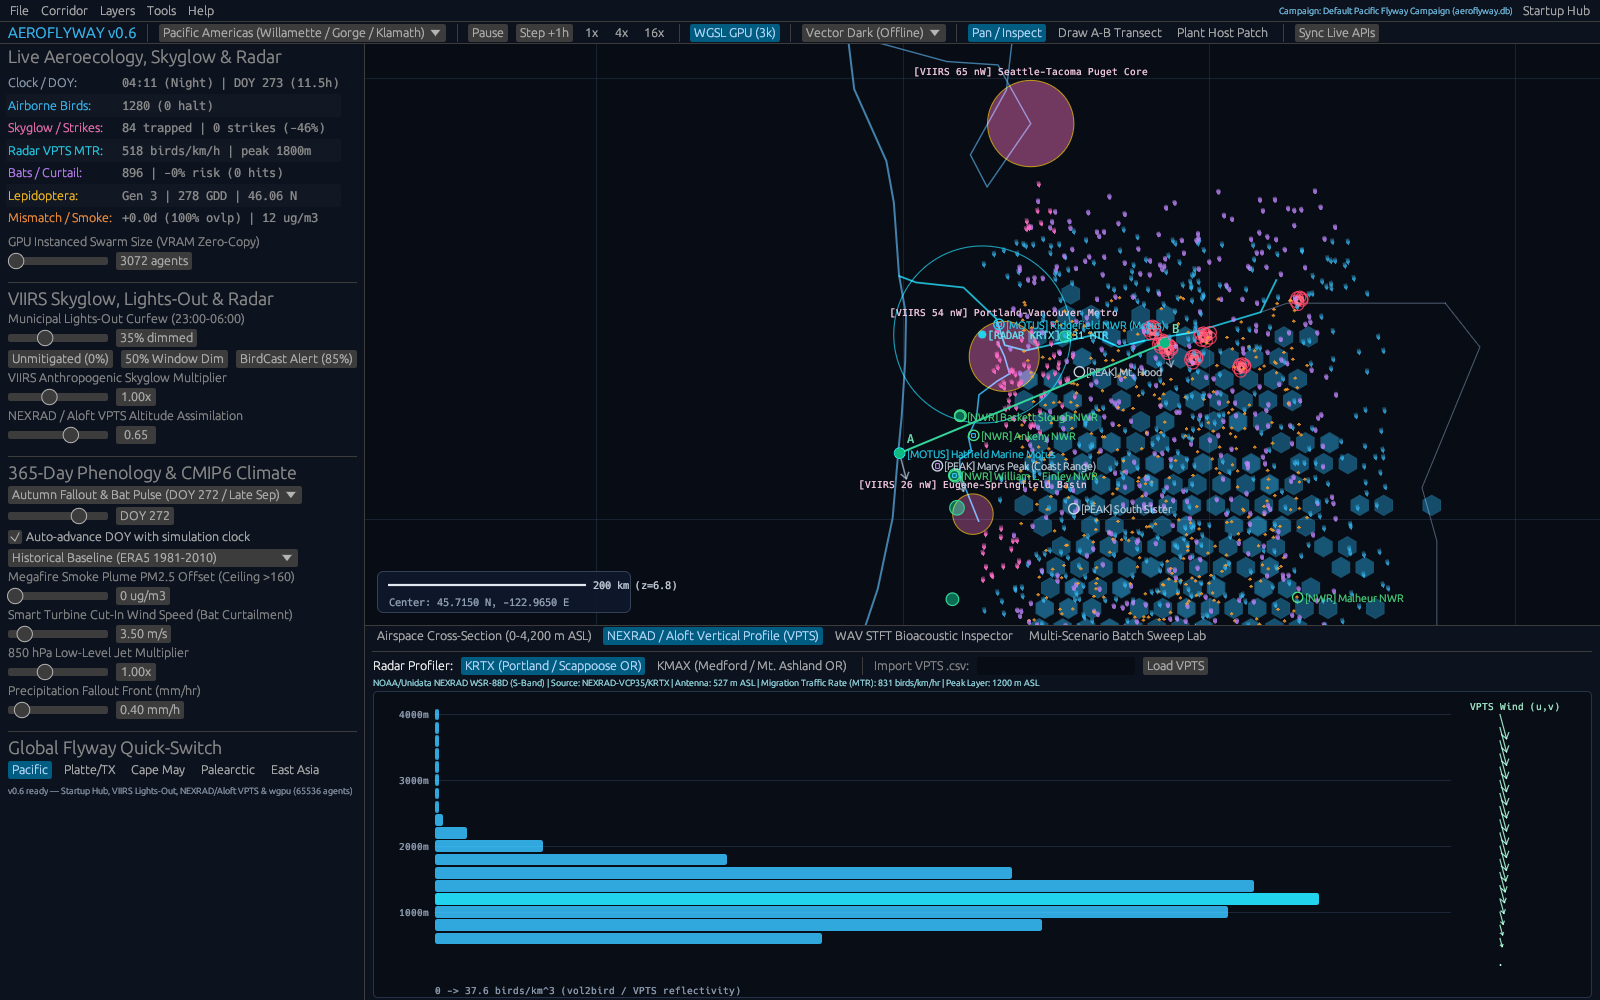
On the radar observation track, ingest.rs imports standard VPTS tables reporting biological reflectivity density, flight speed, and directional headings stacked across atmospheric height layers[2]. Because coastal radar beams frequently bounce off tall steel buildings, harbor bridges, surf clutter, or nearby communication masts in the lowest elevation gates, the reader automatically checks zero radial motion and isolated reflectivity spikes against adjacent clean altitude layers, flagging mechanical clutter so summary migration totals reflect living flocks rather than concrete structures.
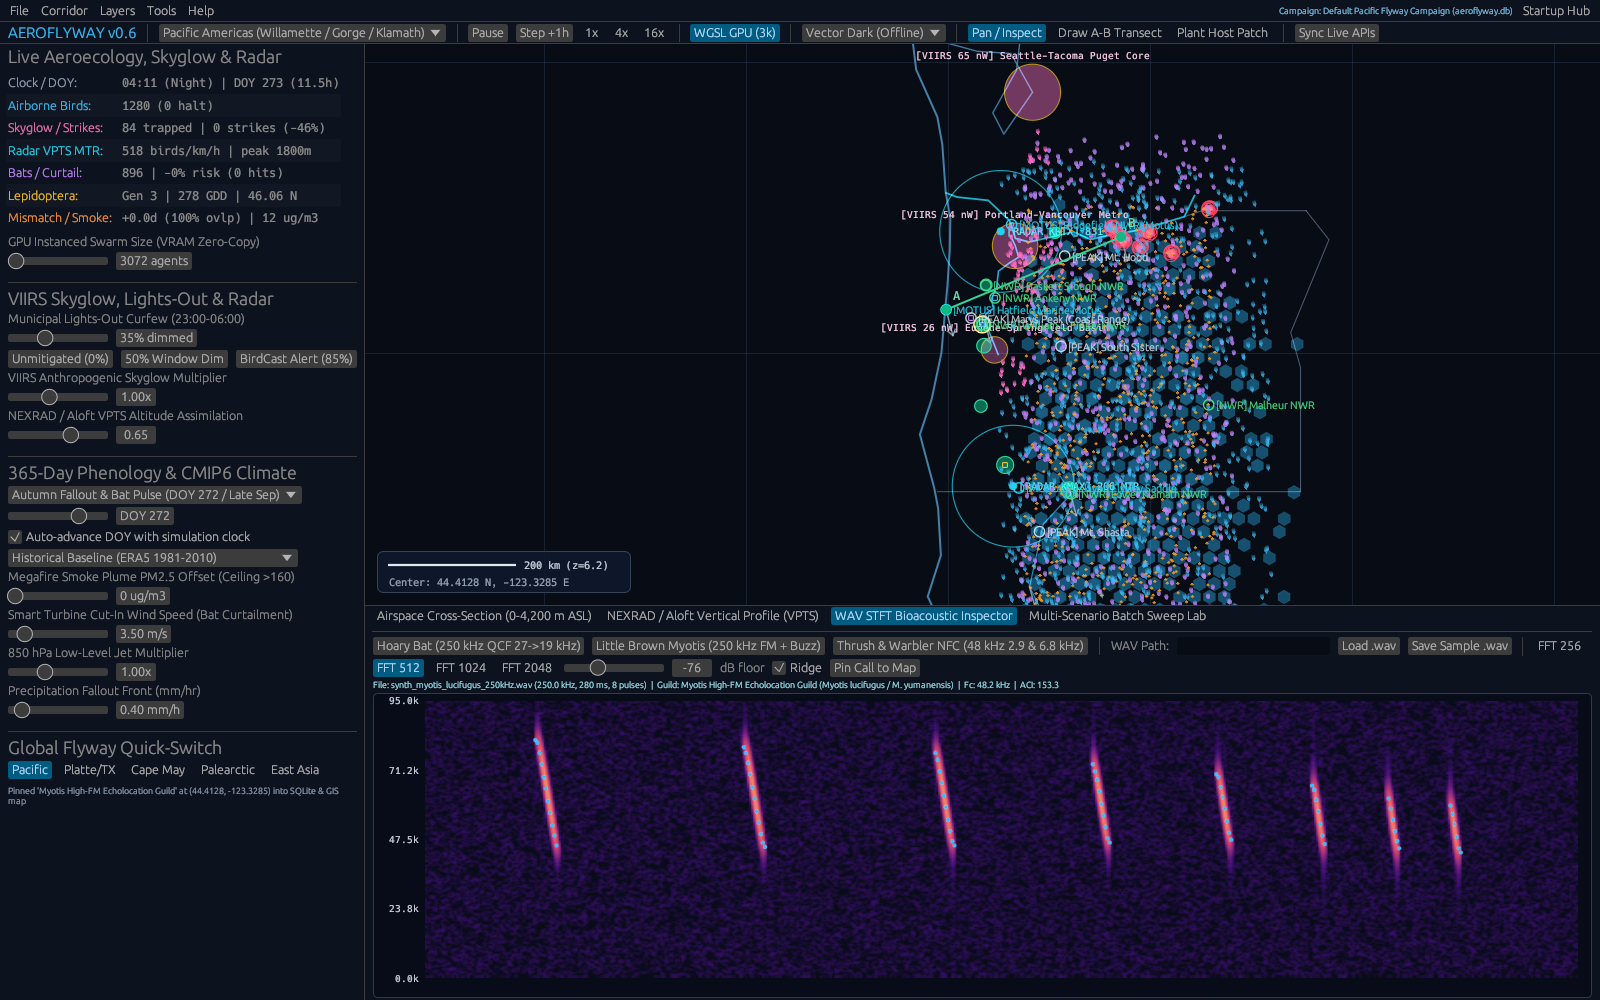
On the acoustic side, acoustics.rs reads uncompressed 48 kHz field WAV files alongside embedded GUANO metadata headers—which store recorder location coordinates, timestamps, microphone gain, and site labels inside standard audio chunks—and divides sound energy into intuitive frequency bands. Lower nocturnal vocal frequencies around 2.5 to 4.5 kHz capture thrush contact whistles cleanly, while high-pitched notes above 6 kHz isolate crisp warbler chips without fragile manual audio scrubbing.
On the spatial simulation side, physics.rs and optional compute shaders in gpu_pipeline.rs advance thousands of virtual songbirds hour by hour along realistic multi-night coastal corridors[1][3]. Each bird maintains its own preferred compass heading and seasonal airspeed while drifting smoothly with ambient winds and responding gently whenever city skyglow exceeds natural night horizons, allowing planners to compare full illumination against graduated curfew schedules directly.
Crucially, because real migration unfolds in punctuated weather pulses rather than flat daily averages, AeroFlyway keeps wind speed, cloud ceiling distraction radius, and illuminated building attraction strictly separated inside its user controls. Analysts can compare a calm high-pressure autumn cold front pushing flocks southward over coastal estuaries against a warm spring drizzle trapping flocks inside glowing skyline canyons, exposing clearly why flexible seasonal lighting alerts rescue far more migrants per kilowatt saved than static year-round rules.
| Module / Crate | What It Does | Citation |
|---|---|---|
physics.rs & gpu_pipeline.rs | Simulates flying birds, wind drift, and attraction to city lights (CPU and GPU compute shaders). | [1], [3] |
ingest.rs | Reads weather radar vertical profiles (VPTS) and removes ground-clutter rows. | [2] |
acoustics.rs | Finds nighttime bird calls in 48 kHz WAV audio files using frequency bands and GUANO tags. | [4–20] |
basemap.rs & map_engine.rs | Draws coastline tiles, radar station locations, and flyway heatmaps. | [1], [2] |
db.rs & export.rs | Stores survey sessions in SQLite and exports clean CSV/GeoJSON tables. | [4–20] |
cli.rs & main.rs | Command-line menu and desktop launcher for running migration scenarios. | [4–20] |
3. Walkthrough of Capabilities & Quantitative Findings
Quantifying the Benefit of "Lights Out" Urban Policies
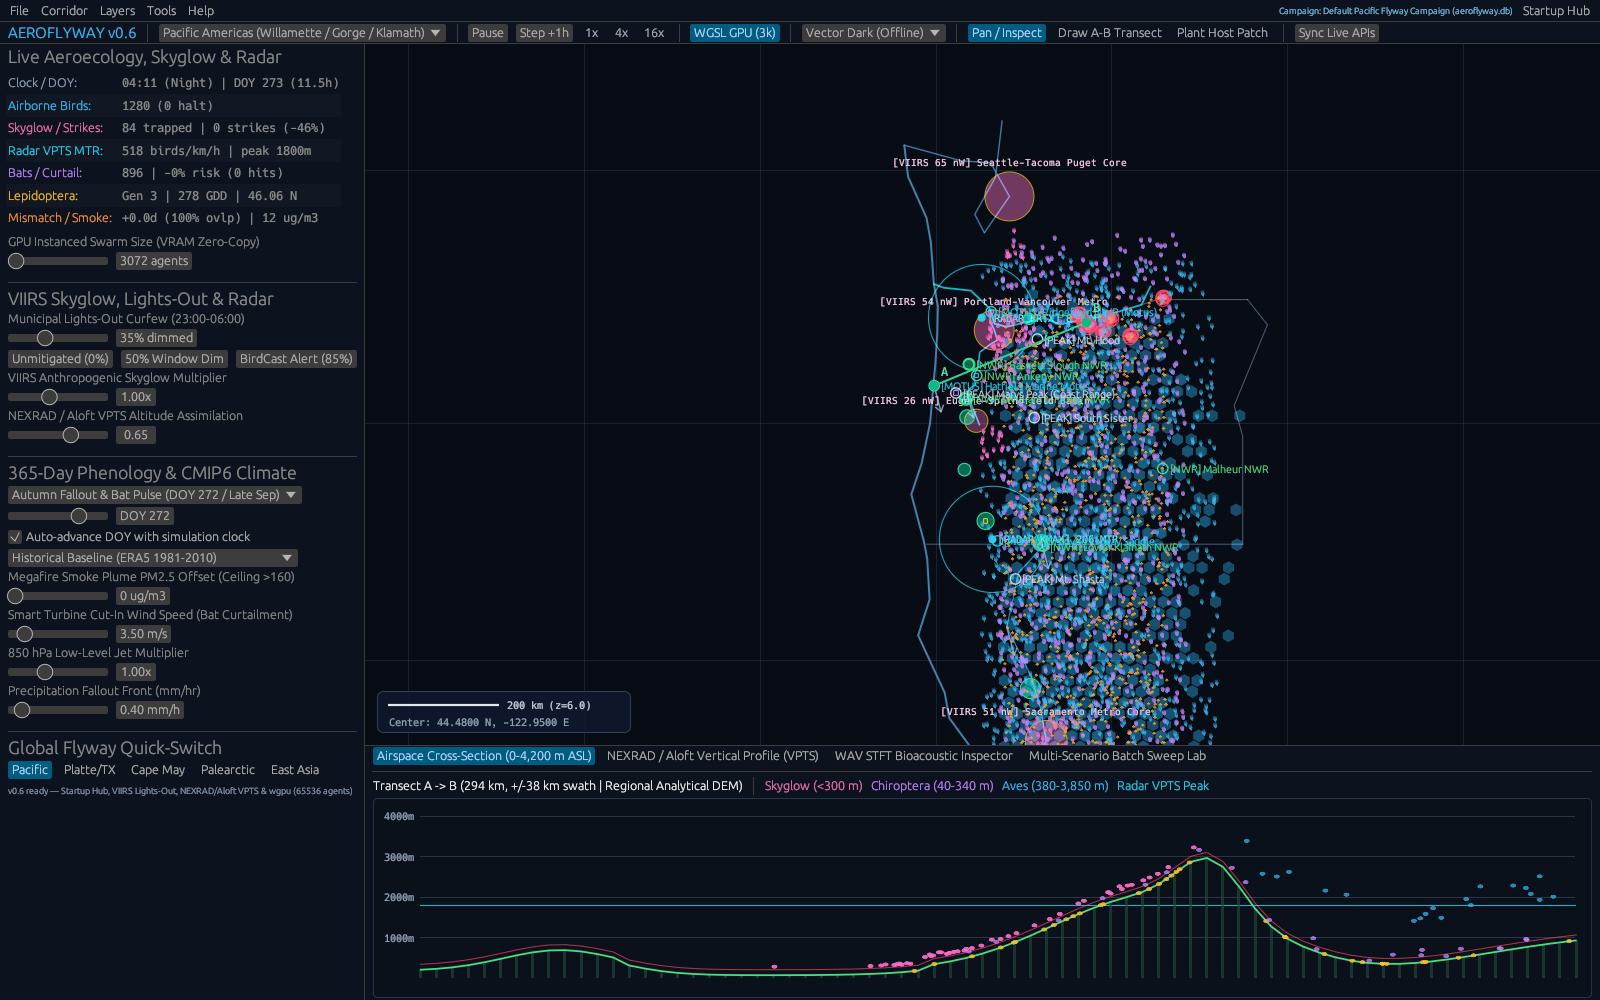
To illustrate how AeroFlyway connects urban lighting policies to concrete ecological outcomes, consider an Atlantic coast migration corridor tracked across 59.25 simulated hours with 1,000 nocturnal migrants crossing near populated shorelines. Under bright baseline illumination producing an ambient skyglow of 85.00 nW/cm2/sr, glowing beacons strongly pulled descending flocks off high-altitude tracks, generating 35 fatal simulated collisions—a 3.5% transit loss over a single active multi-night window. Stepping architectural and skyline illumination down by 80% cut skyglow to 25.16 nW/cm2/sr and dropped simulated fatalities from 35 down to just 1 strike, preventing 94.44% of building collisions. Pushing lighting reductions all the way to 100% lifted avoidance slightly further to 95.0%[3]. Crucially for city decision-makers, almost the entire ecological protection arrives once bright decorative beacons, floodlit spires, and empty commercial upper floors switch off, preserving essential pedestrian street safety while shielding migrating wildlife.
Altitude Structure Along the Mid-Atlantic Flyway
Combining simulation curves with empirical weather radar profiles clarifies why coastal tower heights and overcast skies matter so sharply. Evaluating 12 vertical height layers across three Mid-Atlantic coastal NEXRAD radar sites, ingest.rs filtered ground clutter and measured total Migration Traffic Rates (MTR). Activity peaked over Dover Air Force Base, Delaware (station KDOX), reaching 1,507.7 birds/km/hr with flight concentration centered near 600 m above sea level. Neighboring stations reflected the same broad coastal highway: Wakefield, Virginia (KAKQ) registered 1,037.0 birds/km/hr while Fort Dix, New Jersey (KDIX) recorded 777.0 birds/km/hr[2]. On calm, clear evenings, most birds cruise within a 300 m to 800 m band cleanly above suburban neighborhoods, yet remain vulnerable near downtown high-rise corridors whenever fog or ceiling glare pulls flocks downward before sunrise.
Acoustic Separation and Field Archiving
While Doppler radar counts overall airborne movement without telling species groups apart, rooftop bioacoustic microphones supply indispensable taxonomic context during spring and autumn peaks. Across 48 kHz field audio clips containing overlapping nocturnal vocalizations, AeroFlyway's spectral band classifier separated lower thrush contact notes averaging 3.461 kHz from steep wood-warbler chips peaking near 7.324 kHz with clean separation between vocal guilds. Pairing acoustic guild counts with station radar profiles lets monitors confirm whether high-density blips reflect thrushes flying in steady rain or dense mixed warbler waves descending near dawn. Every station summary and vocal call count serialized accurately into nine structured SQLite database entries alongside ready-to-share CSV exports such as lights_out_mortality_curve.csv and vpts_altitude_profile.csv.
| Capability / Scenario | Scope | Key Finding | Data Output |
|---|---|---|---|
| Lights-Out Policy Sweep | 0% to 80% urban dimming (1,000 birds) | Strikes fell from 35 to 1 (94.4% avoided) | lights_out_mortality_curve.csv |
| Weather Radar Profiles | KDOX, KAKQ, and KDIX altitude bins | 1,507.7 / 1,037.0 / 777.0 birds/km/hr | vpts_altitude_profile.csv |
| Acoustic Call Sorting | 48 kHz thrush vs. warbler recordings | Separated 3.461 kHz vs. 7.324 kHz; 9 SQLite rows | Survey session database |
4. Practical Scenarios: Who Uses AeroFlyway & How
Wildlife Planners, Architects, and Municipal Sustainability Teams
City sustainability officers, commercial building managers, lighting designers, and regional dark-sky coalitions regularly confront a practical communication challenge: proving which nights and which downtown districts yield the strongest conservation payoff when towers participate in seasonal Lights Out programs. Instead of appealing broadly for permanent dark cities, wildlife liaisons can load local VPTS weather radar files straight into AeroFlyway, display the exact 300–800 m cruise window relative to skyscraper elevations, and show property boards with unmistakable collision curves why dimming decorative facades on peak migration nights prevents more than nine out of ten preventable window fatalities[3]. Exported GeoJSON zones integrate cleanly into civic planning maps and voluntary green-building certification pledges.
Ornithology Classrooms and Community Bioacoustics Networks
AeroFlyway equally removes steep software headaches for university field ornithology courses, regional Audubon chapters, coastal nature centers, and backyard acoustic monitors. Students import local 48 kHz WAV audio straight from rooftop recorders, inspect embedded GUANO location and timestamp fields automatically, compare thrush versus warbler frequency peaks directly, and correlate dawn call surges with regional NEXRAD radar traffic aloft. Even community volunteers managing modest hardware stations benefit from clear graphical altitude slices and offline portability, turning neighborhood listening posts into reproducible conservation telemetry without paid subscriptions or remote server bottlenecks.
5. Open Access & Connections Across the CRV Science App Network
Open Access and Connections Across the CRV Science App Network
All AeroFlyway source modules, SQLite workspace schemas, acoustic filters, and user guides are openly shared through the CRV Science Apps Hub at https://crvscience.com/apps. Providing transparent, reproducible inputs and human-readable CSV/GeoJSON files ensures independent conservation teams, high-school teachers, and acoustic volunteers can audit every figure directly.
Within the twelve-application CRV Science ecosystem[4–20], AeroFlyway illustrates how wildlife conservation connects cleanly to climate physics, evolutionary ecology, and applied numerical computing: TerraTwin simulates 21st-century coastal warming and wind-shift pathways reshaping seasonal migration timing; ITME explores 4.25 billion years of planetary oxygenation that set the evolutionary stage for continental biomes; OSABT delivers population-genetics diversity metrics and survival analyses valuable for bird-banding recapture studies; and Calc-Lab teaches the interactive numerical time-stepping foundations driving agent trajectories and wind drift across digital coastlines.
References
- [1] Van Doren, B. M., & Horton, K. G. (2018). A continental system for forecasting bird migration. Science. https://doi.org/10.1126/science.aat7526
- [2] Dokter, A. M., et al. (2018). bioRad: Biological analysis and visualization of weather radar data. Ecography / CRAN. https://doi.org/10.32614/cran.package.biorad
- [3] Van Doren, B. M., et al. (2021). Drivers of fatal bird collisions in an urban center. Proceedings of the National Academy of Sciences. https://doi.org/10.1073/pnas.2101666118
- [4] White, B. P. (2026). The CRV Science App Network: Seventeen Open-Source Rust Programs for Science, Data, and Simulation. CRV Science App Preprint APP-PREPRINT-01 [cs.SE, cs.CE, q-bio.QM], v1.0.0. Hosted via CRV Science Apps Hub (https://crvscience.com/apps). https://doi.org/10.5281/zenodo.24222398
- [5] White, B. P. (2026). BeoFold: Simulating How Proteins Fold Using Distributed Computing and State Networks. CRV Science App Preprint APP-PREPRINT-02 [q-bio.BM, physics.chem-ph, cs.DC], v1.4.0. Hosted via CRV Science Apps Hub (https://crvscience.com/apps). https://doi.org/10.5281/zenodo.24222370
- [6] White, B. P. (2026). Calc-Lab: Interactive Calculus, Linear Algebra, and Differential Equation Solver Workbench. CRV Science App Preprint APP-PREPRINT-03 [math.NA, cs.MS, cs.CY], v0.5.0. Hosted via CRV Science Apps Hub (https://crvscience.com/apps). https://doi.org/10.5281/zenodo.24222372
- [7] White, B. P. (2026). Causal-Atlas: Tracing How Genes and Drugs Turn Biological Pathways On and Off. CRV Science App Preprint APP-PREPRINT-04 [q-bio.MN, q-bio.GN, stat.ML], v0.2.0. Hosted via CRV Science Apps Hub (https://crvscience.com/apps). https://doi.org/10.5281/zenodo.24222376
- [8] White, B. P. (2026). Cit-Atlas: Mapping Citation Networks and Research Impact Across Scientific Papers. CRV Science App Preprint APP-PREPRINT-05 [cs.DL, cs.SI, physics.soc-ph], v1.8.0. Hosted via CRV Science Apps Hub (https://crvscience.com/apps). https://doi.org/10.5281/zenodo.24222380
- [9] White, B. P. (2026). EpiLedger: Privacy-Safe Disease Tracking, Clinical Text Screening, and Outbreak Monitoring. CRV Science App Preprint APP-PREPRINT-06 [cs.CR, q-bio.PE, stat.AP], v2.0.0. Hosted via CRV Science Apps Hub (https://crvscience.com/apps). https://doi.org/10.5281/zenodo.24222382
- [10] White, B. P. (2026). ITME: Simulating Four Billion Years of Life, Oceans, and Atmosphere Evolution. CRV Science App Preprint APP-PREPRINT-07 [q-bio.PE, nlin.AO, physics.bio-ph], v2.3.0. Hosted via CRV Science Apps Hub (https://crvscience.com/apps). https://doi.org/10.5281/zenodo.24222386
- [11] White, B. P. (2026). OSABT: All-in-One Toolkit for Plant Physiology, Survival Curves, Genetics, and Enzyme Kinetics. CRV Science App Preprint APP-PREPRINT-08 [q-bio.QM, stat.AP, cs.SE], v2.0.0. Hosted via CRV Science Apps Hub (https://crvscience.com/apps). https://doi.org/10.5281/zenodo.24222388
- [12] White, B. P. (2026). SAR-Atlas: Drug Design, Body Distribution Modeling, and Candidate Screening in Rust. CRV Science App Preprint APP-PREPRINT-09 [physics.chem-ph, q-bio.BM, cs.LG], v3.8.0. Hosted via CRV Science Apps Hub (https://crvscience.com/apps). https://doi.org/10.5281/zenodo.24222390
- [13] White, B. P. (2026). TerraTwin: Fast Climate Projections for Global Warming, Sea-Level Rise, and Arctic Change. CRV Science App Preprint APP-PREPRINT-10 [physics.ao-ph, cs.CE, stat.AP], v2.5.0. Hosted via CRV Science Apps Hub (https://crvscience.com/apps). https://doi.org/10.5281/zenodo.24222392
- [14] White, B. P. (2026). Urban-Grid: Modeling City Traffic, Emergency Response Coverage, and Earthquake Evacuation. CRV Science App Preprint APP-PREPRINT-11 [physics.soc-ph, cs.MA, cs.CE], v5.2.0. Hosted via CRV Science Apps Hub (https://crvscience.com/apps). https://doi.org/10.5281/zenodo.24222394
- [15] White, B. P. (2026). WildFront BattleGrounds: Turn-Based Hex Strategy Game with Voxel Graphics and Procedural Map Generation. CRV Science App Preprint APP-PREPRINT-12 [cs.GT, cs.GR, math.CO], v3.4.1. Hosted via CRV Science Apps Hub (https://crvscience.com/apps). https://doi.org/10.5281/zenodo.24222396
- [16] White, B. P. (2026). HelioProbe: Simulating Spacecraft Orbits, Deep-Space Telescopes, and Comet Tails in 3D. CRV Science App Preprint APP-PREPRINT-14 [astro-ph.EP, astro-ph.IM, cs.GR], v2.3.0. Hosted via CRV Science Apps Hub (https://crvscience.com/apps). https://doi.org/10.5281/zenodo.24244083
- [17] White, B. P. (2026). PopBio-Studio: Interactive Population Biology, Adaptive Landscapes, and Genetic Skyline Simulator. CRV Science App Preprint APP-PREPRINT-15 [q-bio.PE, q-bio.QM, stat.AP], v1.2.0. Hosted via CRV Science Apps Hub (https://crvscience.com/apps). https://doi.org/10.5281/zenodo.24244085
- [18] White, B. P. (2026). QuantaCrypt-Studio: Simulating Quantum Circuits, Quantum Key Distribution, and Post-Quantum Cryptography. CRV Science App Preprint APP-PREPRINT-16 [quant-ph, cs.CR, cs.MS], v2.2.0. Hosted via CRV Science Apps Hub (https://crvscience.com/apps). https://doi.org/10.5281/zenodo.24244089
- [19] White, B. P. (2026). SonoWing: Analyzing Bat Echolocation and Bird Calls with Spectrograms and Harmonic Tracking. CRV Science App Preprint APP-PREPRINT-17 [q-bio.NC, q-bio.PE, cs.SD], v1.1.0. Hosted via CRV Science Apps Hub (https://crvscience.com/apps). https://doi.org/10.5281/zenodo.24244091
- [20] White, B. P. (2026). SwarmForge: 3D Isometric Automated Factory and Swarm Robotics Simulation Game. CRV Science App Preprint APP-PREPRINT-18 [cs.MA, cs.RO, cs.GT], v1.3.0. Hosted via CRV Science Apps Hub (https://crvscience.com/apps). https://doi.org/10.5281/zenodo.24244093