Overview
Causal-Atlas (v0.2.0) is an open-source functional genomics application designed to help biomedical researchers, pharmacology teams, and students make clear sense of large gene-expression experiments (such as RNA-seq). Traditional pathway checklists typically only ask whether altered genes cluster inside an annotated biological category, discarding a critical clue: whether individual genes changed up or down in the exact direction a regulator is known to push them. Causal-Atlas restores biological directionality inside an offline desktop and terminal program by comparing fold changes against signed causal "activates" and "inhibits" edges, ranking candidate upstream master switches with directional Z-scores, tracing multi-step regulatory chains, and matching disease expression signatures against drug perturbation profiles to pinpoint candidate compounds that flip sick cellular programs back toward baseline. On inflamed human blood-vessel cells (HUVEC + TNF), Causal-Atlas identified TNF (z = +4.47) and NFKB1 (+4.00) as principal drivers, detected Dexamethasone (z = −2.65) as an opposing regulator, and prioritized BMS-345541 (−93.84) atop drug-reversal candidates. Source code, documentation, and companion apps are listed at https://crvscience.com/apps.
1. Real-World Context & Why This Problem Matters
Why Unsigned Pathway Checklists Miss Half the Story
Whenever living human cells encounter bacterial or viral infection, blood-vessel irritation, low oxygen, or a candidate medicine, hundreds or thousands of genes alter their cellular activity inside the nucleus simultaneously. Turning a vast RNA-sequencing (RNA-seq) table into a clear story of what happened inside the tissue ranks among daily challenges in hospital genomics and drug discovery. Traditional over-representation pathway tools primarily execute category-overlap checklists: they ask simply whether a pile of changed genes gathers inside a named biological textbook chapter—such as "vascular inflammation" or "immune signaling"—more frequently than random luck would scatter them.
While helpful for quick initial sorting, simple list-overlap tools throw away the single strongest diagnostic clue printed right in the spreadsheet: directional polarity. Consider a regulatory switch that normally cranks ten defensive stress genes upward while holding five tissue-repair genes suppressed. If diseased tissue turns all ten stress genes downward while boosting all five repair genes upward, an unsigned overlap test blindly shouts that the pathway is "highly active"—failing completely to recognize that the biological switch actually snapped off or ran backward inside those cells.
How Signed Causality and Connectivity Mapping Point Toward Therapies
Signed causal reasoning puts biological polarity back at the center of interpretation[1]. Decades of peer-verified molecular genetics experiments assemble into directed signaling maps carrying explicit plus-one ("turns on") and minus-one ("turns off") edge signs linking upstream switches to downstream gene targets. Before scanning those edges, statistical noise cleanup via Benjamini-Hochberg false-discovery rate (FDR) filtering trims minor random bench fluctuations so irrelevant laboratory background cannot masquerade as organized cell signaling[3].
Once reliable altered genes survive FDR filtering, Upstream Regulator Analysis computes directional Z-scores spiking sharply positive whenever observed gene changes match predicted activation signs—and swinging deep negative whenever experimental cells run directly opposite to a candidate protein or clinical drug[1]. Connectivity Mapping (CMap / L1000) carries that exact mirror-image trick straight into therapy triage: querying reference catalogs of drug-treated cells highlights existing small molecules whose gene signatures point opposite to disease expression, spotlighting treatments poised to flip diseased programs cleanly back toward healthy calm[2]. Causal-Atlas brings FDR cleanup, directional causal chains, and drug reversal scoring strictly offline.
2. Conceptual Design & How Causal-Atlas Works
Local Expression Filtering and Signed Knowledge Graphs
Causal-Atlas (v0.2.0) runs every analytical stage strictly locally on investigators' own laptops or lab desktops—protecting sensitive patient biopsy profiles and confidential screening libraries from third-party cloud uploads—across three modular Rust crates. Experimental tables enter through ca-core, where dea.rs and stats.rs parse log2 fold-changes alongside statistical p-values, filter out steady baseline housekeeping controls that stay flat across healthy and sick tissue, measure empirical variance, and enforce Benjamini-Hochberg false-discovery rate (FDR) thresholds[3] so uninformative background noise drops out early.
Surviving active genes then map onto curated signed directed networks managed inside graph.rs and seed_kb.rs. Unlike flat tag lists, every arrow inside the signed graph records whether molecule A stimulates (+1) or suppresses (−1) target B together with transparent literature support.
Upstream Z-Scores, Multi-Hop Cascades, and Drug Reversal Views
Walking across that signed knowledge graph, Causal-Atlas executes two complementary regulatory search tools[1]. Upstream Regulator Analysis (ura.rs) tests every cytokine, receptor, kinase, or drug directly against its immediate downstream gene set—scoring high positive Z-scores when gene up-and-down patterns match activation faithfully and sharp negative Z-scores when cells invert expectations. Meanwhile, Causal Network Analysis (cna.rs) reaches outward across multi-step three-hop causal chains, uncovering deeper master switches that trigger inflammation indirectly by passing signals through intermediate transcription factors.
Connecting mechanism straight to therapeutics, perturb.rs scores disease signatures against CMap / L1000 small-molecule perturbation archives[2], separating high-scoring positive "disease-mimic" agents from deeply negative "disease-reverser" leads. Companion crates ca-streams and ca-app handle offline SQLite knowledge storage (client.rs, sqlite_store.rs), smooth desktop and keyboard terminal interfaces (gui.rs, tui.rs), and clean vector SVG causal network drawings (svg_export.rs).
| Module / Crate | What It Does | Citation |
|---|---|---|
ca-core/dea.rs & stats.rs | Calculates gene fold-changes, p-values, and Benjamini-Hochberg false-discovery control. | [3] |
ca-core/graph.rs & seed_kb.rs | Builds the signed biological knowledge graph (activates vs. inhibits edges). | [1] |
ca-core/ura.rs & cna.rs | Scores upstream regulators (Z-scores) and expands multi-hop causal chains. | [1] |
ca-core/perturb.rs | Matches gene signatures against L1000/CMap drugs to find mimics and reversers. | [2] |
ca-streams (client.rs, sqlite_store.rs) | Fetches and caches public pathway datasets locally in SQLite. | [4–20] |
ca-app (gui.rs, tui.rs, svg_export.rs) | Desktop window, terminal view, and SVG chart exporter. | [4–20] |

3. Walkthrough of Capabilities & Quantitative Findings
Pinpointing Inflammatory Switches in Human Vascular Cells
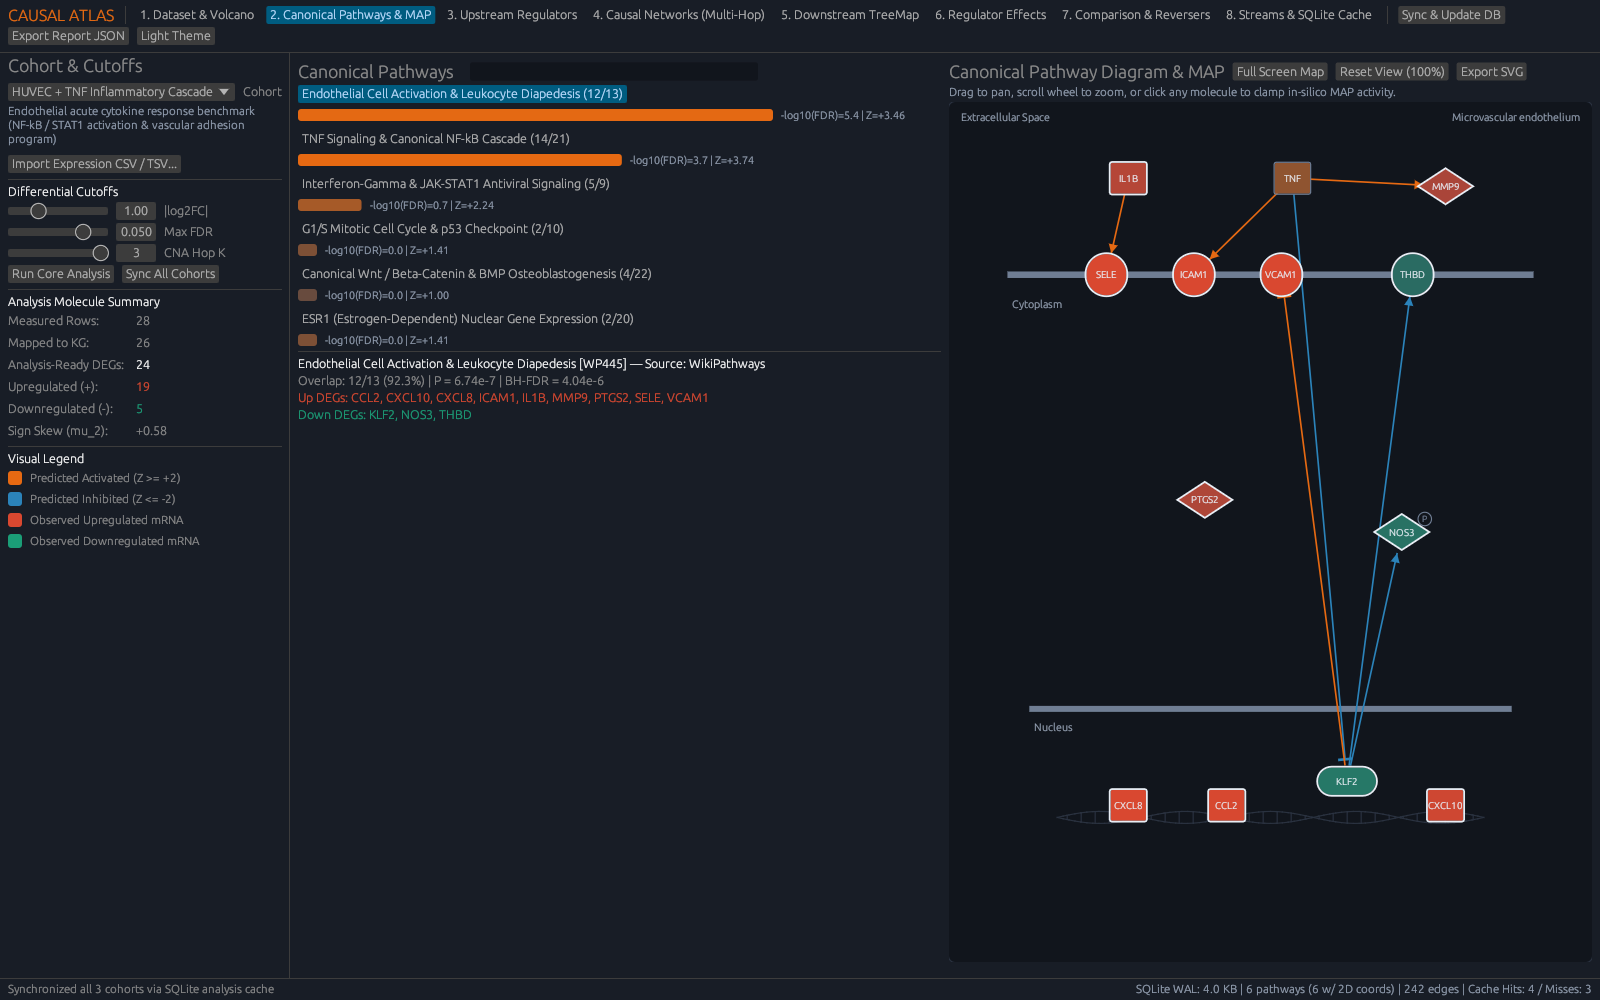
Following a concrete benchmark dataset on human vascular biology—primary human umbilical vein endothelial cells (HUVEC) stimulated with pro-inflammatory tumor necrosis factor (TNF)—illustrates Causal-Atlas clearly. Across 28 measured transcripts containing four steady internal housekeeping controls, Benjamini-Hochberg FDR filtering cleanly extracted 24 significantly perturbed genes. Surging at the very top sat two unmistakable endothelial adhesion molecules: SELE (+5.10 log2 fold change) and VCAM1 (+4.82)—the exact cell-surface Velcro anchors inflamed blood-vessel walls push outward so white blood cells latch onto vessel linings and enter damaged tissue.
Directional Regulator Ranking, Inversion Checks, and Drug Leads
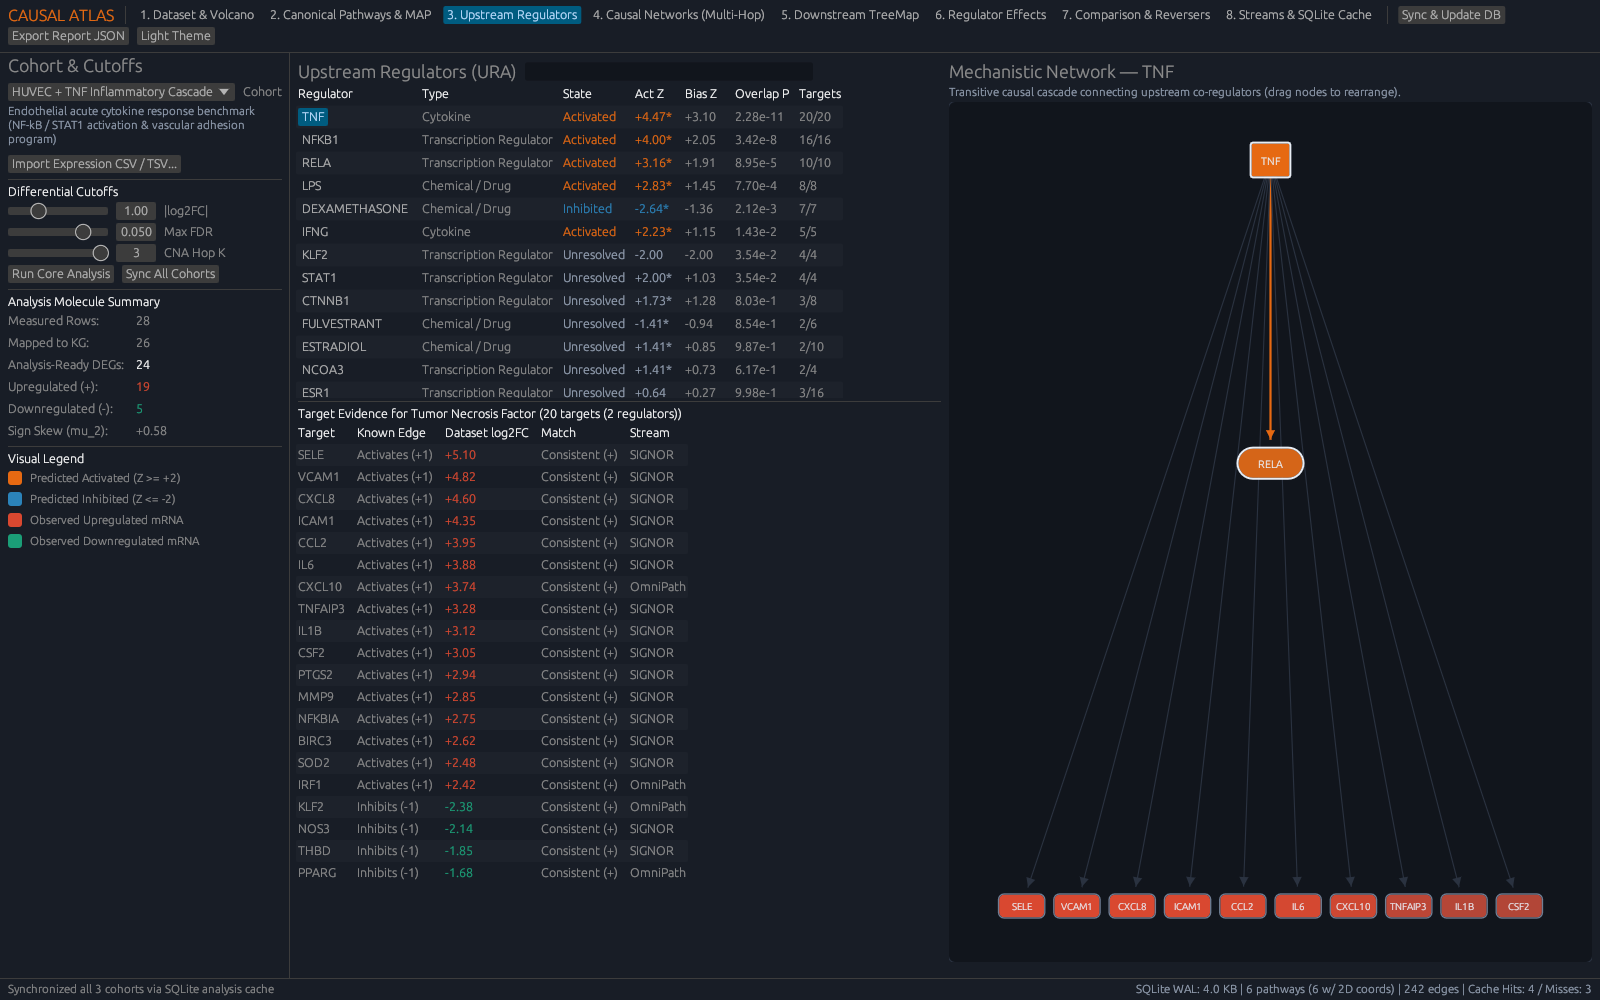
Evaluating directional agreement across the signed causal network immediately lifted TNF itself to rank 1 upstream driver (z = +4.4703, aligning across 20 out of 20 downstream target directions cleanly), followed closely by central subunits of the master inflammatory transcription switch NF-kappa-B—NFKB1 (z = +3.9969) and RELA (z = +3.1595)—alongside bacterial endotoxin trigger lipopolysaccharide (LPS, z = +2.8279)[1]. Just as revealing, clinical anti-inflammatory glucocorticoid Dexamethasone appeared strongly negative (z = −2.6450), proving mathematically without external clues that inflamed vessel cells behaved strictly opposite to steroid therapy.
Testing whether directional polarity flips authentically on distinct biology, switching inputs to an estrogen-receptor stimulation experiment immediately reversed leaderboards: ESR1 surged to z = +3.9966 while TNF inverted smoothly negative to z = −1.7320. Expanding 25 three-hop causal cascades and screening seven L1000 reference compounds prioritized selective IKK-beta blocker BMS-345541 (reversal score −93.84) and Dexamethasone (−75.89) atop drug leads predicted to quiet vascular activation[2], saving ranked results transparently to upstream_regulators_ranked.csv.
Looking closely at everyday cell mechanics helps translate those Z-scores and reversal metrics into intuitive biology. When circulating inflammatory cytokines brush past endothelial cells lining blood vessels, NF-kappa-B complexes slip rapidly inside the cell nucleus and switch on emergency beacon genes such as SELE (+5.10) and VCAM1 (+4.82)—the exact molecular grappling hooks that flag patrolling white blood cells down out of rushing plasma. Checking directional signs across all twenty immediate TNF targets proves coherently that those blood-vessel linings did not merely shift randomly: every observed target tilted harmoniously along the exact pro-inflammatory script expected when TNF signaling fires strongly.
Tracing three-hop causal chains carries diagnostic clarity one step deeper whenever an upstream trigger acts indirectly. Rather than halting at molecules touching target DNA directly, walking three edges outward illuminates secondary relay amplifiers sitting upstream of NFKB1 and RELA. Conversely, why does a large negative Connectivity Mapping score (−93.84 for BMS-345541) excite therapeutic chemists? Because an experimental treatment that suppresses exactly the inflammatory surface beacons elevated in sick vascular cells—while nudging suppressed homeostatic genes upward—acts chemically as an opposing mirror image poised to nudge inflamed tissue back toward resting vascular health[2].
In everyday hospital research or university seminars, this directional workflow also prevents a costly false start. Instead of writing grant proposals around whichever textbook pathway contains the highest raw count of noisy genes, investigators follow verifiable activation arrows right down to primary supporting studies and check offline whether an existing approved steroid or targeted kinase agent reverses the same signature cleanly.
| Analytical Stage | Biological Scope | Key Finding | Data Output |
|---|---|---|---|
| Differential Expression | 28 HUVEC + TNF genes (FDR filtered) | 24 active genes; SELE +5.10, VCAM1 +4.82 | Expression table |
| Signed Regulator Scoring | Upstream Z-scores + ESR1 polarity check | TNF +4.47, NFKB1 +4.00, Dex −2.65; ESR1 +4.00 | upstream_regulators_ranked.csv |
| Causal Chains & Drugs | 25 depth-3 networks + 7 CMap compounds | BMS-345541 (−93.84) & Dex (−75.89) top reversers | Drug reversal ranking |
4. Practical Scenarios: Who Uses Causal-Atlas & How
Hospital Translational Labs and Confidential Pharma Triage
Hospital clinical genomics teams evaluating de-identified patient biopsies alongside early biotechnology groups testing proprietary small molecules regularly operate under strict data-governance bans blocking uploads to external web servers. Because Causal-Atlas maintains SQLite knowledge bases completely locally and runs FDR control, directional Z-scores, multi-hop causal tracing, and CMap drug ranking strictly offline on Windows, Linux, or macOS workstations, proprietary RNA-seq tables never leave institutional custody on their path toward crisp publication SVG panels.
Teaching Genomics Beyond Simple Gene Checklists
University molecular biology and pharmacology instructors equally find Causal-Atlas clarifying inside undergraduate bioinformatics studios: learners watch Benjamini-Hochberg thresholds trim false signals[3], observe regulator Z-scores invert sign cleanly between inflammatory cytokines and steroid hormones, and see concretely how IKK-beta inhibition via BMS-345541 counteracts NFKB1/TNF signaling cascades[2].
Empowering Bench Biologists to Prioritize Confident Experiments
Before committing months of reagent budgets, cell culture plates, and animal-model approvals to a new hypothesis, wet-lab biologists and graduate fellows often struggle to look past hundreds of noisy gene fluctuations toward the small handful of master switches actually steering disease progression. By turning complex expression tables into transparent multi-step causal chains, Causal-Atlas lets researchers visually trace how an upstream inflammatory trigger ripples through intermediate transcription factors and how candidate compounds might reverse that cascade on screen before a single pipette moves. Equally important, its transparent statistical guardrails prevent small pilot cohorts from being over-interpreted when natural biological variability blurs subtle expression changes. Independent science educators and medical writers can also walk directly through published disease comparisons step by step without programming backgrounds. Hosted within the unified open workbench at crvscience.com/apps, the software connects cellular gene-regulation maps cleanly with companion protein-folding and chemical-structure tools across desktop workstations without cloud lock-in or per-seat subscription barriers.
5. Open Access & Connections Across the CRV Science App Network
Open Access and Connections Across the CRV Science App Network
All Causal-Atlas expression filters, signed causal graph scorers, CMap reversal algorithms, and offline storage layers live open-source on the CRV Science Apps Hub at https://crvscience.com/apps for public auditing, campus workshops, and independent extension.
Across the twelve-application CRV Science suite[4–20], Causal-Atlas forms the cellular bridge tying genomic regulation directly to drug chemistry and public health: SAR-Atlas inspects whether prioritized reversers like BMS-345541 balance solubility, oral absorption, and receptor binding geometry; BeoFold simulates dynamic structural protein folding stability around signaling hubs; OSABT resolves enzyme inhibition curves and cohort survival comparisons directly from bench data; and EpiLedger safeguards patient identity when cellular insights scale into clinical outbreak registries.
References
- [1] Krämer, A., et al. (2013). Causal analysis approaches in Ingenuity Pathway Analysis. Bioinformatics. https://doi.org/10.1093/bioinformatics/btt703
- [2] Subramanian, A., et al. (2017). A Next Generation Connectivity Map: L1000 Platform and the First 1,000,000 Profiles. Cell. https://doi.org/10.1016/j.cell.2017.10.049
- [3] Benjamini, Y., & Hochberg, Y. (1995). Controlling the False Discovery Rate: A Practical and Powerful Approach to Multiple Testing. Journal of the Royal Statistical Society Series B. https://doi.org/10.1111/j.2517-6161.1995.tb02031.x
- [4] White, B. P. (2026). The CRV Science App Network: Seventeen Open-Source Rust Programs for Science, Data, and Simulation. CRV Science App Preprint APP-PREPRINT-01 [cs.SE, cs.CE, q-bio.QM], v1.0.0. Hosted via CRV Science Apps Hub (https://crvscience.com/apps). https://doi.org/10.5281/zenodo.24222398
- [5] White, B. P. (2026). AeroFlyway: Tracking Bird Migration with Weather Radar, Skyglow Maps, and Nighttime Flight Calls. CRV Science App Preprint APP-PREPRINT-13 [q-bio.PE, physics.ao-ph, cs.GR], v0.6.0. Hosted via CRV Science Apps Hub (https://crvscience.com/apps). https://doi.org/10.5281/zenodo.24222366
- [6] White, B. P. (2026). BeoFold: Simulating How Proteins Fold Using Distributed Computing and State Networks. CRV Science App Preprint APP-PREPRINT-02 [q-bio.BM, physics.chem-ph, cs.DC], v1.4.0. Hosted via CRV Science Apps Hub (https://crvscience.com/apps). https://doi.org/10.5281/zenodo.24222370
- [7] White, B. P. (2026). Calc-Lab: Interactive Calculus, Linear Algebra, and Differential Equation Solver Workbench. CRV Science App Preprint APP-PREPRINT-03 [math.NA, cs.MS, cs.CY], v0.5.0. Hosted via CRV Science Apps Hub (https://crvscience.com/apps). https://doi.org/10.5281/zenodo.24222372
- [8] White, B. P. (2026). Cit-Atlas: Mapping Citation Networks and Research Impact Across Scientific Papers. CRV Science App Preprint APP-PREPRINT-05 [cs.DL, cs.SI, physics.soc-ph], v1.8.0. Hosted via CRV Science Apps Hub (https://crvscience.com/apps). https://doi.org/10.5281/zenodo.24222380
- [9] White, B. P. (2026). EpiLedger: Privacy-Safe Disease Tracking, Clinical Text Screening, and Outbreak Monitoring. CRV Science App Preprint APP-PREPRINT-06 [cs.CR, q-bio.PE, stat.AP], v2.0.0. Hosted via CRV Science Apps Hub (https://crvscience.com/apps). https://doi.org/10.5281/zenodo.24222382
- [10] White, B. P. (2026). ITME: Simulating Four Billion Years of Life, Oceans, and Atmosphere Evolution. CRV Science App Preprint APP-PREPRINT-07 [q-bio.PE, nlin.AO, physics.bio-ph], v2.3.0. Hosted via CRV Science Apps Hub (https://crvscience.com/apps). https://doi.org/10.5281/zenodo.24222386
- [11] White, B. P. (2026). OSABT: All-in-One Toolkit for Plant Physiology, Survival Curves, Genetics, and Enzyme Kinetics. CRV Science App Preprint APP-PREPRINT-08 [q-bio.QM, stat.AP, cs.SE], v2.0.0. Hosted via CRV Science Apps Hub (https://crvscience.com/apps). https://doi.org/10.5281/zenodo.24222388
- [12] White, B. P. (2026). SAR-Atlas: Drug Design, Body Distribution Modeling, and Candidate Screening in Rust. CRV Science App Preprint APP-PREPRINT-09 [physics.chem-ph, q-bio.BM, cs.LG], v3.8.0. Hosted via CRV Science Apps Hub (https://crvscience.com/apps). https://doi.org/10.5281/zenodo.24222390
- [13] White, B. P. (2026). TerraTwin: Fast Climate Projections for Global Warming, Sea-Level Rise, and Arctic Change. CRV Science App Preprint APP-PREPRINT-10 [physics.ao-ph, cs.CE, stat.AP], v2.5.0. Hosted via CRV Science Apps Hub (https://crvscience.com/apps). https://doi.org/10.5281/zenodo.24222392
- [14] White, B. P. (2026). Urban-Grid: Modeling City Traffic, Emergency Response Coverage, and Earthquake Evacuation. CRV Science App Preprint APP-PREPRINT-11 [physics.soc-ph, cs.MA, cs.CE], v5.2.0. Hosted via CRV Science Apps Hub (https://crvscience.com/apps). https://doi.org/10.5281/zenodo.24222394
- [15] White, B. P. (2026). WildFront BattleGrounds: Turn-Based Hex Strategy Game with Voxel Graphics and Procedural Map Generation. CRV Science App Preprint APP-PREPRINT-12 [cs.GT, cs.GR, math.CO], v3.4.1. Hosted via CRV Science Apps Hub (https://crvscience.com/apps). https://doi.org/10.5281/zenodo.24222396
- [16] White, B. P. (2026). HelioProbe: Simulating Spacecraft Orbits, Deep-Space Telescopes, and Comet Tails in 3D. CRV Science App Preprint APP-PREPRINT-14 [astro-ph.EP, astro-ph.IM, cs.GR], v2.3.0. Hosted via CRV Science Apps Hub (https://crvscience.com/apps). https://doi.org/10.5281/zenodo.24244083
- [17] White, B. P. (2026). PopBio-Studio: Interactive Population Biology, Adaptive Landscapes, and Genetic Skyline Simulator. CRV Science App Preprint APP-PREPRINT-15 [q-bio.PE, q-bio.QM, stat.AP], v1.2.0. Hosted via CRV Science Apps Hub (https://crvscience.com/apps). https://doi.org/10.5281/zenodo.24244085
- [18] White, B. P. (2026). QuantaCrypt-Studio: Simulating Quantum Circuits, Quantum Key Distribution, and Post-Quantum Cryptography. CRV Science App Preprint APP-PREPRINT-16 [quant-ph, cs.CR, cs.MS], v2.2.0. Hosted via CRV Science Apps Hub (https://crvscience.com/apps). https://doi.org/10.5281/zenodo.24244089
- [19] White, B. P. (2026). SonoWing: Analyzing Bat Echolocation and Bird Calls with Spectrograms and Harmonic Tracking. CRV Science App Preprint APP-PREPRINT-17 [q-bio.NC, q-bio.PE, cs.SD], v1.1.0. Hosted via CRV Science Apps Hub (https://crvscience.com/apps). https://doi.org/10.5281/zenodo.24244091
- [20] White, B. P. (2026). SwarmForge: 3D Isometric Automated Factory and Swarm Robotics Simulation Game. CRV Science App Preprint APP-PREPRINT-18 [cs.MA, cs.RO, cs.GT], v1.3.0. Hosted via CRV Science Apps Hub (https://crvscience.com/apps). https://doi.org/10.5281/zenodo.24244093