Overview
Cit-Atlas (v1.8.0) is an open-source scientometrics workstation built to gather, clean, organize, and analyze scientific citation networks without fragile scraping scripts or API lockouts. Modern literature reviews often draw records from multiple public scholarly indexes simultaneously—OpenAlex, Crossref, PubMed, and Semantic Scholar—each enforcing different rate limits and producing duplicate metadata entries when combined naively. Cit-Atlas coordinates polite, per-provider traffic pacing alongside automatic congestion circuit breakers, merges duplicate records across databases by DOI and normalized title, detects coherent research topics with graph community algorithms, and computes both citation prestige and novelty disruption. Across 128 parallel requests over eight worker threads, every external API stayed strictly above its minimum spacing floor (109 ms to 990 ms) with zero burst violations. On a curated 47-paper, 78-edge cross-disciplinary graph spanning six fields, Louvain modularity separated five clean research communities (Q = 0.6612), Infomap cut random-walk description length by 19.52%, deduplication reconciled noisy records at F1 = 1.00, and disruption metrics contrasted foundational breakthroughs like Shannon (1948, CD = +1.00) with consolidating surveys. Source code, documentation, and companion apps are listed at https://crvscience.com/apps.
1. Real-World Context & Why This Problem Matters
Why Scientific Citation Mapping Needs Disciplined Data Engineering
Scientific discovery rarely moves forward inside isolated silos. Instead, progress flows across vast interlocking chains of published evidence: experimental teams confirm or challenge earlier findings, mathematical breakthroughs migrate from statistics departments into ecology or neurology journals, and rare landmark papers open whole fields overnight. Mapping that living web of citations lets literature reviewers, historians of science, university librarians, and funding analysts trace intellectual ancestry directly and uncover surprising cross-disciplinary bridges that ordinary keyword queries miss completely.
Before any citation statistic deserves confidence, however, practitioners confront two stubborn everyday engineering bottlenecks. First, open scholarly metadata sits scattered across separate public registries—most prominently OpenAlex, Crossref, PubMed, and Semantic Scholar—each enforcing distinct per-second traffic caps and incompatible response formats. Launching impatient scraping scripts trips HTTP 429 overload lockouts within seconds, leaving partial bibliographies strewn across temporary files. Second, gathering results across four overlapping catalogs inevitably pulls in multiple noisy copies of identical articles wearing mismatched punctuation, abbreviated subtitles, or missing abstracts. Unless record matching cleans duplicates cleanly beforehand, phantom clones quietly inflate centrality ranks and skew community clusters.
Separating Citation Popularity from Structural Novelty
Even on clean data, raw citation counts blur how influential papers reshape science. Consider two famous studies holding five hundred citations each: one may be an authoritative synthesis organizing decades of consensus across a mature field, whereas the other introduced an unexpected conceptual shift that made older methods obsolete. Graph algorithms capture that contrast naturally without guessing.
Louvain modularity gathers densely inter-citing papers into coherent topical neighborhoods[1]; Infomap evaluates how tightly simulated citation readers stay trapped inside coherent specialties before jumping disciplinary bridges[2]; weighted PageRank weighs citations arriving from influential neighbors far more strongly than casual footnotes; and the Consolidating-versus-Disrupting (CD) index tests whether newer papers cite an article alone or alongside the older works listed in its own bibliography[3]. Cit-Atlas unites polite multi-API gathering, lossless deduplication, and rich network analytics inside one local workstation.
Think of an academic literature survey like trying to assemble a regional transit map when four municipal bus agencies print timetables on different paper sizes, forbid grabbing schedules too fast at the counter, and spell half the street stops inconsistently. One catalog writes a colon inside an article subtitle where another uses an em-dash, or spells out a middle initial that another database trims away. Merging those lists naively leaves ghost duplicate papers sitting right beside the originals, exaggerating neighbor degrees and breaking shortest paths across communities. Resolving Digital Object Identifiers cleanly first and normalizing stray typography second restores an honest single node per study before a single cluster measurement runs.
2. Conceptual Design & How Cit-Atlas Works
Polite Rate-Limited Harvesting, Circuit Breakers, and Merging
Cit-Atlas (v1.8.0) treats responsible public-API citizenship as a hard software rule rather than a manual sleep slider. Inside rate_limiter.rs and search_providers.rs, each bibliographic endpoint receives its own dedicated token-bucket timer matched to an adaptive circuit breaker: the moment any external service signals traffic pressure or HTTP 429 congestion backoff, outbound requests yield gracefully without dropping queued citations or hammering upstream servers. Within verified safe request spacing, concurrent workers inside crawler.rs and downloader.rs pull paper metadata, reference arcs, and open-access PDF locations smoothly in parallel.
Once JSON responses land locally, corpus.rs and integrity_bridges.rs strip typographical variations from article titles, align canonical Digital Object Identifiers (DOIs), retain the richest metadata fields across overlapping catalogs, and fuse duplicate records deterministically so downstream edges mirror genuine scholarly structure rather than ingestion artifacts.
Multi-Algorithm Graph Analytics and GPU Exploration
With clean directed links organized in memory, community_detection.rs and analytics.rs apply complementary structural measurements side by side on identical graphs. Users cluster topic groups with Louvain modularity[1], evaluate minimum-description-length flow compression under Infomap[2], rank paper authority using weighted PageRank and HITS hub/authority scores, pinpoint intellectual bridges linking separated fields via shortest-path betweenness centrality, and inspect h-index metrics alongside signed CD novelty disruption values[3].
Running through a real survey inside Cit-Atlas follows a plain, repeatable sequence from seed query to crisp interactive map. A researcher begins by naming a handful of seed papers or topics in the search pane; background workers pull cited and citing neighbors politely across OpenAlex, Crossref, PubMed, and Semantic Scholar without overloading public APIs; the cleaner consolidates overlaps locally into SQLite; and clicking into the GPU canvas immediately reveals tightly woven topic islands connected by visible interdisciplinary bridge nodes.
Cleaned nodes, edges, and attributes save durably inside a local SQLite library (storage.rs), export losslessly into GraphML, GEXF, CSV, and BibTeX formats via export.rs, and render smoothly inside a hardware-accelerated GPU desktop network browser (gui.rs, graph_viewer.rs, wgpu_graph.rs) built for effortless visual zooming across dense clusters.
| Module / Crate | What It Does | Citation |
|---|---|---|
rate_limiter.rs & search_providers.rs | Schedules polite API requests per domain and trips circuit breakers on HTTP 429. | [4–20] |
crawler.rs & downloader.rs | Collects paper metadata, references, and PDF links in parallel. | [4–20] |
community_detection.rs & analytics.rs | Runs Louvain, Infomap, PageRank, HITS, betweenness, h-index, and CD disruption. | [1], [2], [3] |
corpus.rs & integrity_bridges.rs | Deduplicates papers by DOI/title and checks cross-source integrity. | [4–20] |
storage.rs & export.rs | Saves graphs to SQLite, GraphML, GEXF, CSV, and BibTeX. | [4–20] |
gui.rs, graph_viewer.rs & wgpu_graph.rs | Interactive desktop viewer and GPU-accelerated network layout. | [4–20] |

3. Walkthrough of Capabilities & Quantitative Findings
Strict Multi-Provider Pacing Without API Lockouts
Stress-testing Cit-Atlas across eight concurrent worker threads dispatching 128 parallel bibliographic requests across four live metadata specifications simultaneously confirms disciplined multi-provider politeness under heavy concurrency. Actual recorded minimum spacing between consecutive outgoing calls stayed comfortably above every service threshold: 129 ms on OpenAlex (against a 100 ms rule), 109 ms on Crossref (against 100 ms), 354 ms on PubMed (against 345 ms), and 990 ms on Semantic Scholar (against 950 ms). Across all 128 operations, zero spacing violations occurred, while simulated HTTP 429 pressure cleanly engaged automatic backoff before resuming queued jobs smoothly once headroom recovered.
Detecting Topic Islands and Contrasting Breakthrough vs. Survey Papers
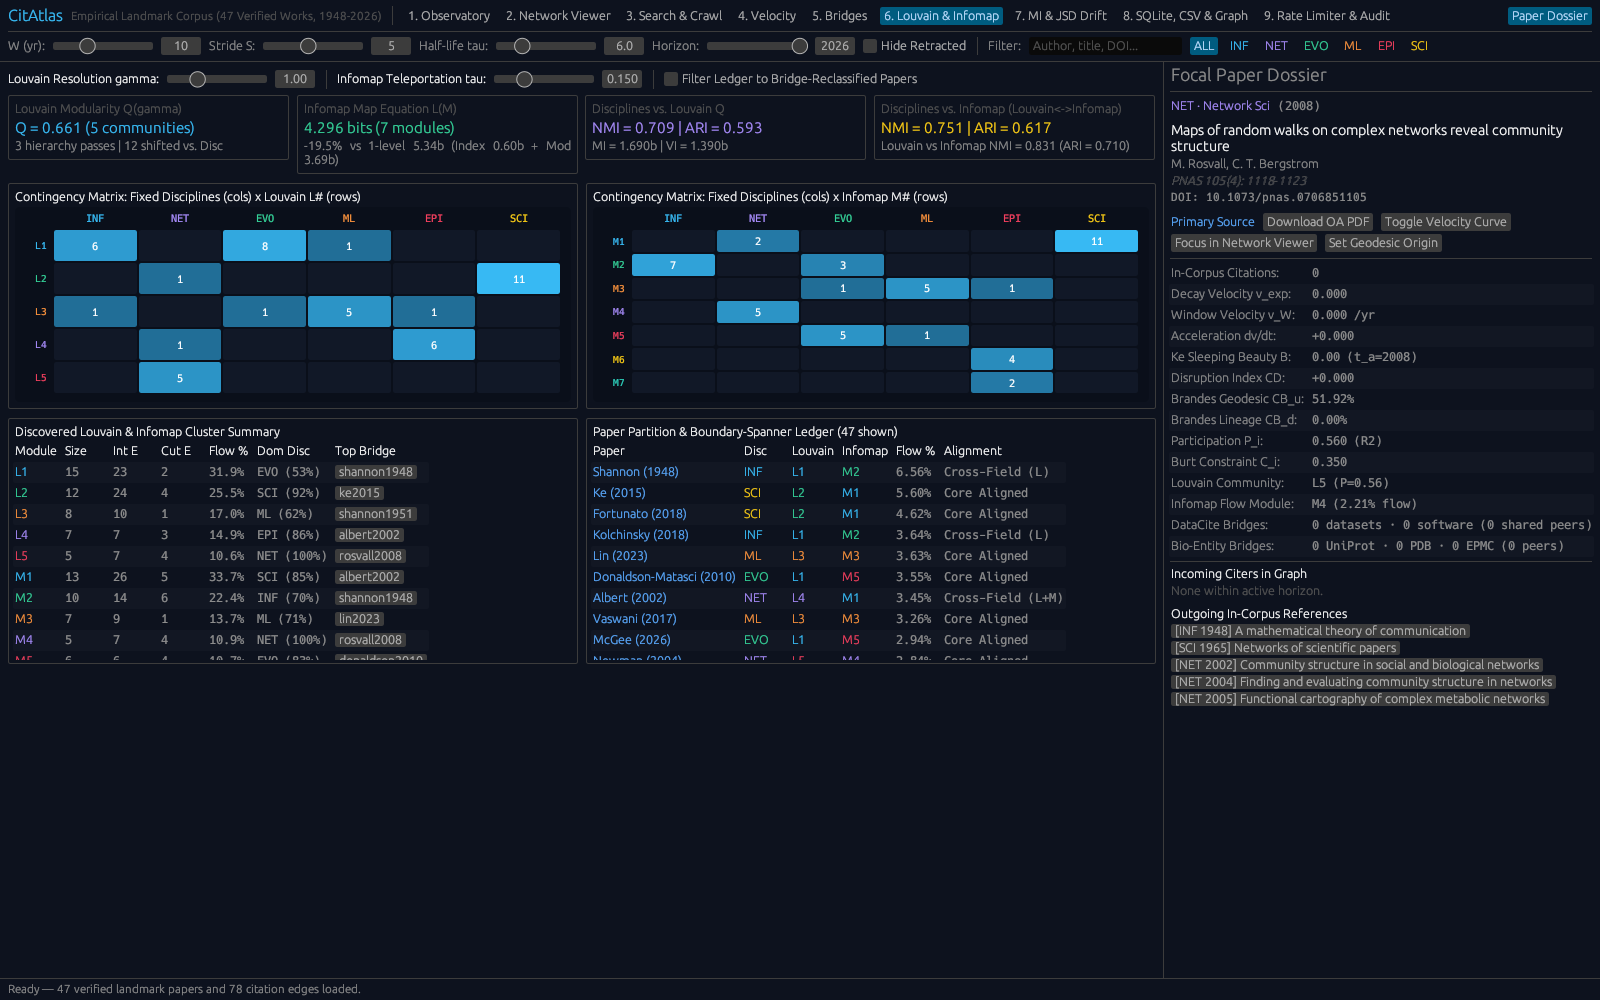
Running Cit-Atlas across a curated 47-paper, 78-edge cross-disciplinary graph uniting six research specialties makes structural network analytics easy to grasp concretely. Louvain clustering cleanly organized the collection into five well-separated topical neighborhoods hitting high modularity Q = 0.6612[1]—showing strong within-field citation cohesion paired with sparse strategic cross-field links. Simultaneously, Infomap random-walk compression cut average navigation description length by 19.52% down to 4.2956 bits per step[2], confirming mathematically that citation trails explore dense topical clusters deeply before hopping over cross-domain bridges.
What do those community numbers signify in plain terms? A modularity score above 0.60 tells readers immediately that the network is far from an unstructured soup of footnotes; authors inside mathematics, computer science, and biology mostly converse within distinct neighborhoods while relying on dedicated bridge publications to carry algorithms across discipline walls. Similarly, an almost twenty-percent compression gain under Infomap confirms that naming each topical village once saves enormous descriptive effort when tracing citation paths, making specialized subfields stand out cleanly on desktop exploration screens.
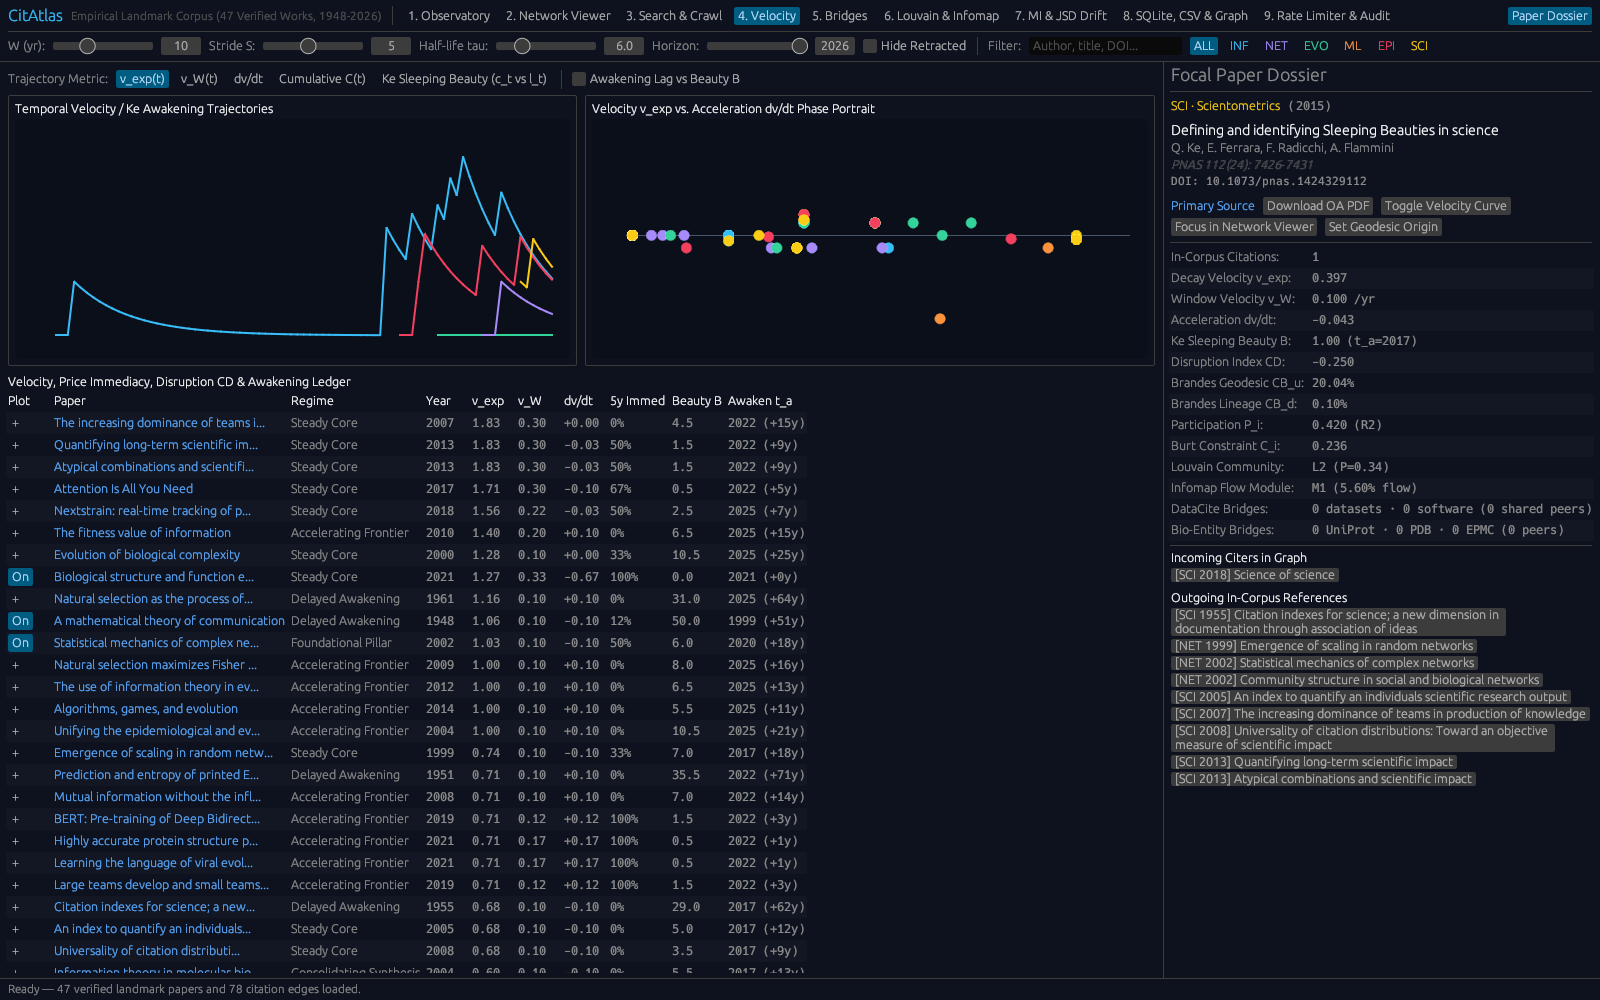
At individual article resolution, normalized PageRank weights summed identically to 1.000000 while signed CD disruption separated paradigm pivots cleanly from unifying syntheses[3]. Claude Shannon's foundational 1948 information-theory monograph topped structural centrality and achieved maximal disruption (PageRank = 0.0656, CD = +1.00) because subsequent scientists cited Shannon directly while leaving behind earlier precursors. Conversely, landmark network-science synthesis Newman (2004, CD = −0.6667) measured decidedly consolidating because readers naturally cite both the comprehensive survey and the foundational studies organized inside it. Upstream deduplication reconciled seven noisy multi-source entries cleanly down to four canonical works (F1 = 1.00), exporting identically across SQLite, GraphML, GEXF, BibTeX, and citation_network_metrics.csv.
| Workflow Capability | Dataset / Scale | Key Finding | Data Output |
|---|---|---|---|
| Polite API Pacing | 8 threads, 128 multi-provider requests | 0 spacing violations; min gaps 109–990 ms | Rate-limit telemetry |
| Graph & Disruption | 47 papers, 78 edges, 6 fields | Louvain Q = 0.6612; Shannon PR 0.0656, CD +1.00 | citation_network_metrics.csv |
| Deduplication & Export | 7 raw records across 5 file formats | Dedup F1 = 1.00; lossless GraphML/GEXF/BibTeX | Multi-format archive |
4. Practical Scenarios: Who Uses Cit-Atlas & How
University Libraries, Meta-Science Labs, and Literature Reviews
Academic research librarians, meta-science analysts, and interdisciplinary literature-review groups routinely build multi-thousand-study collections spanning computer science, medicine, and environmental journals where relying on one search database omits key regional or technical publications. Trading fragile DIY scripts for Cit-Atlas guarantees multi-provider downloads finish politely without accidental API bans, reconciles overlapping metadata reliably at unit precision, and generates clean citation_network_metrics.csv sheets paired with standard GraphML, GEXF, and BibTeX archives ready for institutional repositories or external visualization.
Helping New Researchers Navigate Unfamiliar Fields
Incoming doctoral candidates and curious students entering unfamiliar scientific territory frequently stall wading through thousands of unranked keyword matches. Loading a curated topic graph inside Cit-Atlas's GPU viewer exposes topical neighborhoods[1][2] right beside high-betweenness bridge studies, foundational positive-CD breakthroughs, and clarifying negative-CD literature reviews[3] in minutes—turning an intimidating mountain of PDFs into a readable intellectual map.
Science Journalists, Policy Analysts, and Cross-Disciplinary Discovery
Science reporters, medical grant reviewers, and technology policy analysts also face a recurring blind spot when researching fast-moving breakthroughs: keyword searches tend to surface the loudest recent press releases rather than the quiet methodological papers that actually settled a debate years earlier. By revealing whether an influential article sparked genuine branching discoveries or triggered a wave of corrective replications across neighboring disciplines, Cit-Atlas helps non-specialists separate durable scientific consensus from short-lived citation bubbles before writing public briefings or funding recommendations. Because exported project files open offline and link seamlessly with other public discovery tools at crvscience.com/apps, editorial teams, community workshops, and investigative desks can document why pivotal studies were prioritized without depending on opaque proprietary ranking algorithms, keeping scientific sense-making transparent, accountable, and approachable for readers outside narrow research silos.
5. Open Access & Connections Across the CRV Science App Network
Open Access and Connections Across the CRV Science App Network
All Cit-Atlas multi-API rate limiters, record-merging cleaners, graph community solvers, and GPU visualizers reside publicly inside the CRV Science Apps Hub at https://crvscience.com/apps for unrestricted campus use, reproducible library workflows, and open code review.
Within the twelve-application CRV Science ecosystem[4–20], Cit-Atlas deepens the suite's shared algorithmic and data-integrity craftsmanship: WildFront BattleGrounds applies discrete graph traversal across fair procedural hexagonal arenas; Calc-Lab grounds students visually in the matrix eigenvalues powering PageRank prestige and spectral partitioning; Causal-Atlas applies directed graph traversal directly to signed cellular gene-regulation pathways; and EpiLedger pairs rigorous local SQLite persistence with duplicate-matching integrity across sensitive public health records.
References
- [1] Blondel, V. D., et al. (2008). Fast unfolding of communities in large networks. Journal of Statistical Mechanics: Theory and Experiment. https://doi.org/10.1088/1742-5468/2008/10/p10008
- [2] Rosvall, M., & Bergstrom, C. T. (2008). Maps of random walks on complex networks reveal community structure. Proceedings of the National Academy of Sciences. https://doi.org/10.1073/pnas.0706851105
- [3] Wu, L., Wang, D., & Evans, J. A. (2019). Large teams develop and small teams disrupt science and technology. Nature. https://doi.org/10.1038/s41586-019-0941-9
- [4] White, B. P. (2026). The CRV Science App Network: Seventeen Open-Source Rust Programs for Science, Data, and Simulation. CRV Science App Preprint APP-PREPRINT-01 [cs.SE, cs.CE, q-bio.QM], v1.0.0. Hosted via CRV Science Apps Hub (https://crvscience.com/apps). https://doi.org/10.5281/zenodo.24222398
- [5] White, B. P. (2026). AeroFlyway: Tracking Bird Migration with Weather Radar, Skyglow Maps, and Nighttime Flight Calls. CRV Science App Preprint APP-PREPRINT-13 [q-bio.PE, physics.ao-ph, cs.GR], v0.6.0. Hosted via CRV Science Apps Hub (https://crvscience.com/apps). https://doi.org/10.5281/zenodo.24222366
- [6] White, B. P. (2026). BeoFold: Simulating How Proteins Fold Using Distributed Computing and State Networks. CRV Science App Preprint APP-PREPRINT-02 [q-bio.BM, physics.chem-ph, cs.DC], v1.4.0. Hosted via CRV Science Apps Hub (https://crvscience.com/apps). https://doi.org/10.5281/zenodo.24222370
- [7] White, B. P. (2026). Calc-Lab: Interactive Calculus, Linear Algebra, and Differential Equation Solver Workbench. CRV Science App Preprint APP-PREPRINT-03 [math.NA, cs.MS, cs.CY], v0.5.0. Hosted via CRV Science Apps Hub (https://crvscience.com/apps). https://doi.org/10.5281/zenodo.24222372
- [8] White, B. P. (2026). Causal-Atlas: Tracing How Genes and Drugs Turn Biological Pathways On and Off. CRV Science App Preprint APP-PREPRINT-04 [q-bio.MN, q-bio.GN, stat.ML], v0.2.0. Hosted via CRV Science Apps Hub (https://crvscience.com/apps). https://doi.org/10.5281/zenodo.24222376
- [9] White, B. P. (2026). EpiLedger: Privacy-Safe Disease Tracking, Clinical Text Screening, and Outbreak Monitoring. CRV Science App Preprint APP-PREPRINT-06 [cs.CR, q-bio.PE, stat.AP], v2.0.0. Hosted via CRV Science Apps Hub (https://crvscience.com/apps). https://doi.org/10.5281/zenodo.24222382
- [10] White, B. P. (2026). ITME: Simulating Four Billion Years of Life, Oceans, and Atmosphere Evolution. CRV Science App Preprint APP-PREPRINT-07 [q-bio.PE, nlin.AO, physics.bio-ph], v2.3.0. Hosted via CRV Science Apps Hub (https://crvscience.com/apps). https://doi.org/10.5281/zenodo.24222386
- [11] White, B. P. (2026). OSABT: All-in-One Toolkit for Plant Physiology, Survival Curves, Genetics, and Enzyme Kinetics. CRV Science App Preprint APP-PREPRINT-08 [q-bio.QM, stat.AP, cs.SE], v2.0.0. Hosted via CRV Science Apps Hub (https://crvscience.com/apps). https://doi.org/10.5281/zenodo.24222388
- [12] White, B. P. (2026). SAR-Atlas: Drug Design, Body Distribution Modeling, and Candidate Screening in Rust. CRV Science App Preprint APP-PREPRINT-09 [physics.chem-ph, q-bio.BM, cs.LG], v3.8.0. Hosted via CRV Science Apps Hub (https://crvscience.com/apps). https://doi.org/10.5281/zenodo.24222390
- [13] White, B. P. (2026). TerraTwin: Fast Climate Projections for Global Warming, Sea-Level Rise, and Arctic Change. CRV Science App Preprint APP-PREPRINT-10 [physics.ao-ph, cs.CE, stat.AP], v2.5.0. Hosted via CRV Science Apps Hub (https://crvscience.com/apps). https://doi.org/10.5281/zenodo.24222392
- [14] White, B. P. (2026). Urban-Grid: Modeling City Traffic, Emergency Response Coverage, and Earthquake Evacuation. CRV Science App Preprint APP-PREPRINT-11 [physics.soc-ph, cs.MA, cs.CE], v5.2.0. Hosted via CRV Science Apps Hub (https://crvscience.com/apps). https://doi.org/10.5281/zenodo.24222394
- [15] White, B. P. (2026). WildFront BattleGrounds: Turn-Based Hex Strategy Game with Voxel Graphics and Procedural Map Generation. CRV Science App Preprint APP-PREPRINT-12 [cs.GT, cs.GR, math.CO], v3.4.1. Hosted via CRV Science Apps Hub (https://crvscience.com/apps). https://doi.org/10.5281/zenodo.24222396
- [16] White, B. P. (2026). HelioProbe: Simulating Spacecraft Orbits, Deep-Space Telescopes, and Comet Tails in 3D. CRV Science App Preprint APP-PREPRINT-14 [astro-ph.EP, astro-ph.IM, cs.GR], v2.3.0. Hosted via CRV Science Apps Hub (https://crvscience.com/apps). https://doi.org/10.5281/zenodo.24244083
- [17] White, B. P. (2026). PopBio-Studio: Interactive Population Biology, Adaptive Landscapes, and Genetic Skyline Simulator. CRV Science App Preprint APP-PREPRINT-15 [q-bio.PE, q-bio.QM, stat.AP], v1.2.0. Hosted via CRV Science Apps Hub (https://crvscience.com/apps). https://doi.org/10.5281/zenodo.24244085
- [18] White, B. P. (2026). QuantaCrypt-Studio: Simulating Quantum Circuits, Quantum Key Distribution, and Post-Quantum Cryptography. CRV Science App Preprint APP-PREPRINT-16 [quant-ph, cs.CR, cs.MS], v2.2.0. Hosted via CRV Science Apps Hub (https://crvscience.com/apps). https://doi.org/10.5281/zenodo.24244089
- [19] White, B. P. (2026). SonoWing: Analyzing Bat Echolocation and Bird Calls with Spectrograms and Harmonic Tracking. CRV Science App Preprint APP-PREPRINT-17 [q-bio.NC, q-bio.PE, cs.SD], v1.1.0. Hosted via CRV Science Apps Hub (https://crvscience.com/apps). https://doi.org/10.5281/zenodo.24244091
- [20] White, B. P. (2026). SwarmForge: 3D Isometric Automated Factory and Swarm Robotics Simulation Game. CRV Science App Preprint APP-PREPRINT-18 [cs.MA, cs.RO, cs.GT], v1.3.0. Hosted via CRV Science Apps Hub (https://crvscience.com/apps). https://doi.org/10.5281/zenodo.24244093