Overview
OSABT (v2.0.0, Open-Source Applied Biostatistics Toolkit) is an all-in-one desktop, terminal, and command-line workbench uniting 20 quantitative engines essential to modern biology labs, ecological field stations, and molecular genetics courses. Everyday biological investigations constantly cross disciplinary boundaries—jumping from leaf gas-exchange curves and stream dissolved-oxygen budgets to toxicology survival regressions, sequence population genetics, DNA cloning assembly, and enzyme inhibition kinetics—yet each calculation typically lives inside separate spreadsheet templates or brittle scripts. OSABT ends that fragmentation in one fast, dependency-free native Rust executable. Across representative biological and laboratory datasets, OSABT fitted C3 leaf photosynthesis at R^2 = 0.999957, modeled stream oxygen balance to 0.000281 mg/L RMSE, resolved Cox survival hazard ratios cleanly (HR = 7.81, Probit LC50 = 27.00), measured population divergence across 28 FASTA records (Hudson Fst = 0.7945), cleaved and assembled exact 1,047-bp plasmid fragments (99.6% Golden Gate ligation fidelity), and solved competitive and tight-binding enzyme kinetics down to R^2 >= 0.999995. Source code, documentation, and companion apps are listed at https://crvscience.com/apps.
1. Real-World Context & Why This Problem Matters
Why Biology Labs Lose Days to Quantitative Fragmentation
Quantitative work inside an active university biology department, coastal watershed monitoring station, or wet biochemistry bench covers an astonishing breadth of biological scale within a single work week. On Monday morning, a plant ecophysiologist brings portable gas-exchange analyzer tables back from the greenhouse needing Farquhar-von Caemmerer-Berry (FvCB) curves to distinguish stomatal limitation from biochemical Rubisco limits[1]. On Tuesday afternoon, an aquatic ecologist downloads underwater oxygen-probe traces from a shaded woodland creek to measure daily ecosystem photosynthesis versus nighttime community respiration via Odum's classic open-water budget[2].
Midweek, an environmental toxicologist evaluates censored survival times with Kaplan-Meier lifetables and Cox proportional hazards[3] while checking acute lethal dose thresholds, and before Friday's lab meeting a molecular student checks primer melting stability, designs seamless Golden Gate cloning overhangs, measures sequence differentiation from FASTA/VCF files, and fits enzyme inhibitor assays. Running those analyses traditionally meant hopping awkwardly among separate R packages, fragile Python notebooks breaking on library updates, error-prone Excel sheets, and web forms demanding external data uploads.
Consolidating 20 Vetted Workflows Inside One Reliable Binary
Converting files repeatedly between disconnected tools wastes bench hours and quietly invites unit-conversion mistakes—especially at remote biological field stations without reliable broadband access. OSABT (Open-Source Applied Biostatistics Toolkit) solves that everyday fragmentation cleanly by assembling 20 vetted physiological, ecological, statistical, genetic, and molecular calculators inside a single self-contained native Rust executable delivering uniform calculations across desktop, terminal, and scripted workflows.
2. Conceptual Design & How OSABT Works
Four Core Biological Pillars Behind Uniform Interfaces
OSABT (v2.0.0) exposes every one of its 20 calculation engines consistently across a graphical desktop interface, a structured keyboard terminal view, and scriptable CLI commands so students and research automation share identical numerical accuracy. Within ecological physiology, flux_leaf.rs fits nonlinear FvCB biochemical models to leaf carbon-assimilation curves[1], separating maximum Rubisco carboxylation capacity (Vcmax) cleanly from electron-transport regeneration bounds (Jmax). Beside it, flux_stream.rs models open-channel river reaeration alongside daytime oxygen production and 24-hour community respiration[2].
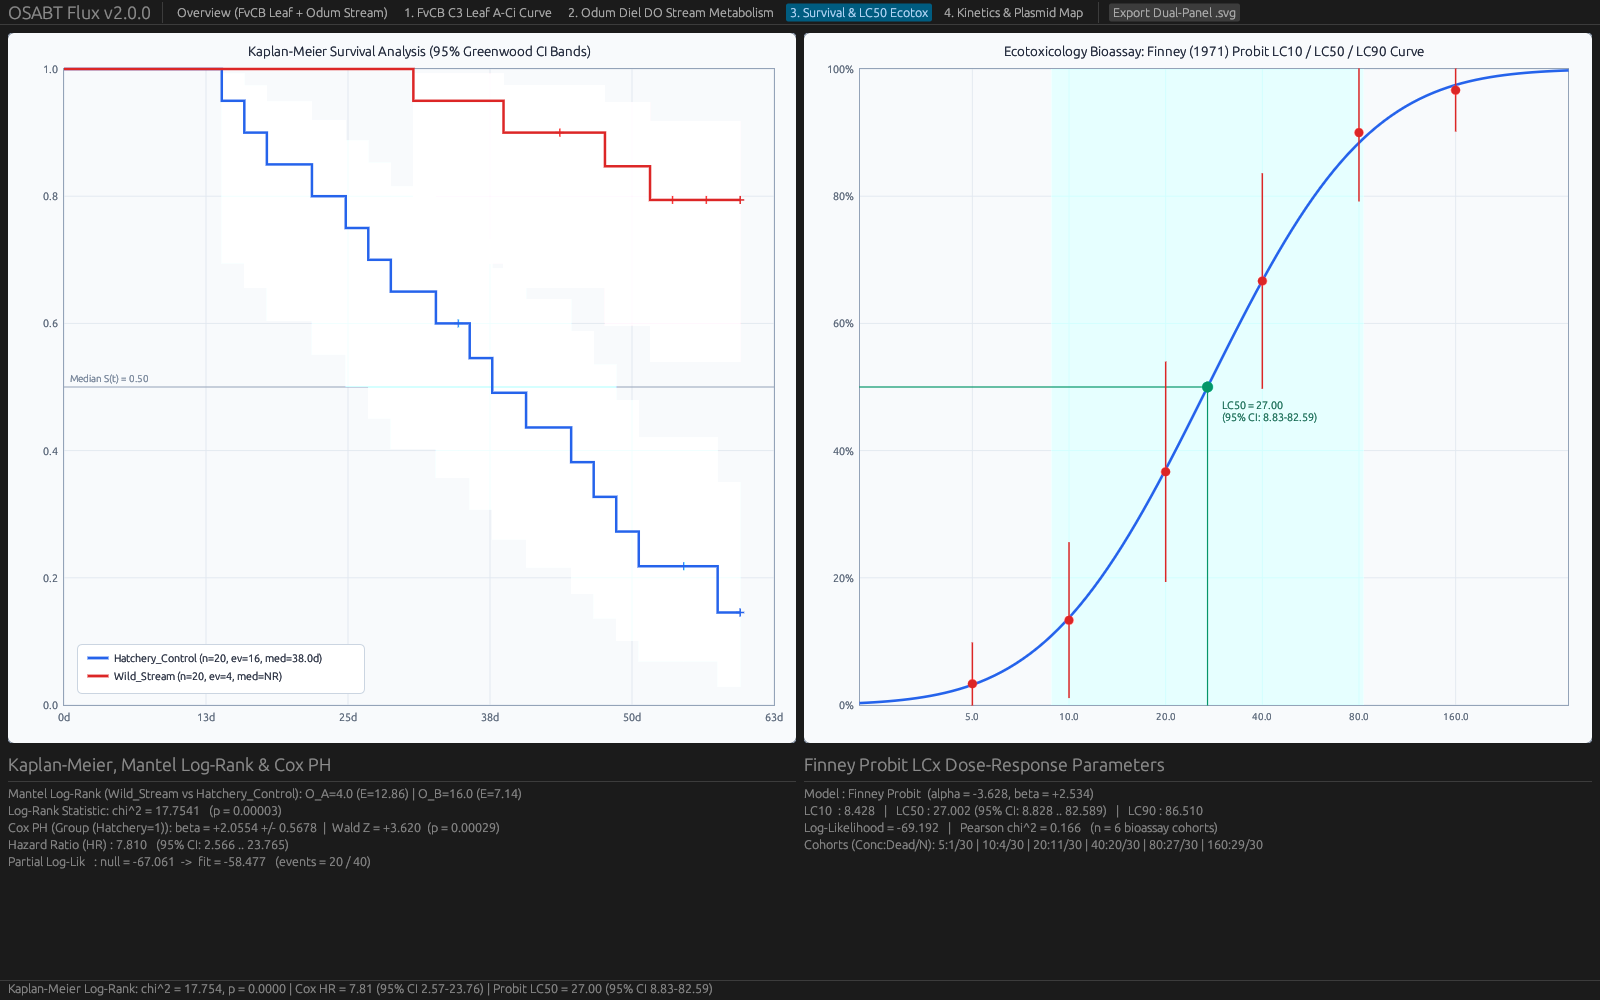
Across biostatistics and environmental toxicology, survival_core.rs and survival_tox.rs perform censored Kaplan-Meier survival curves, log-rank cohort tests, semi-parametric Cox proportional-hazards regressions[3], and Probit/Logit median lethal concentration estimation (LC50).
Genetics, Cloning Design, Enzymology, and Extended Modules
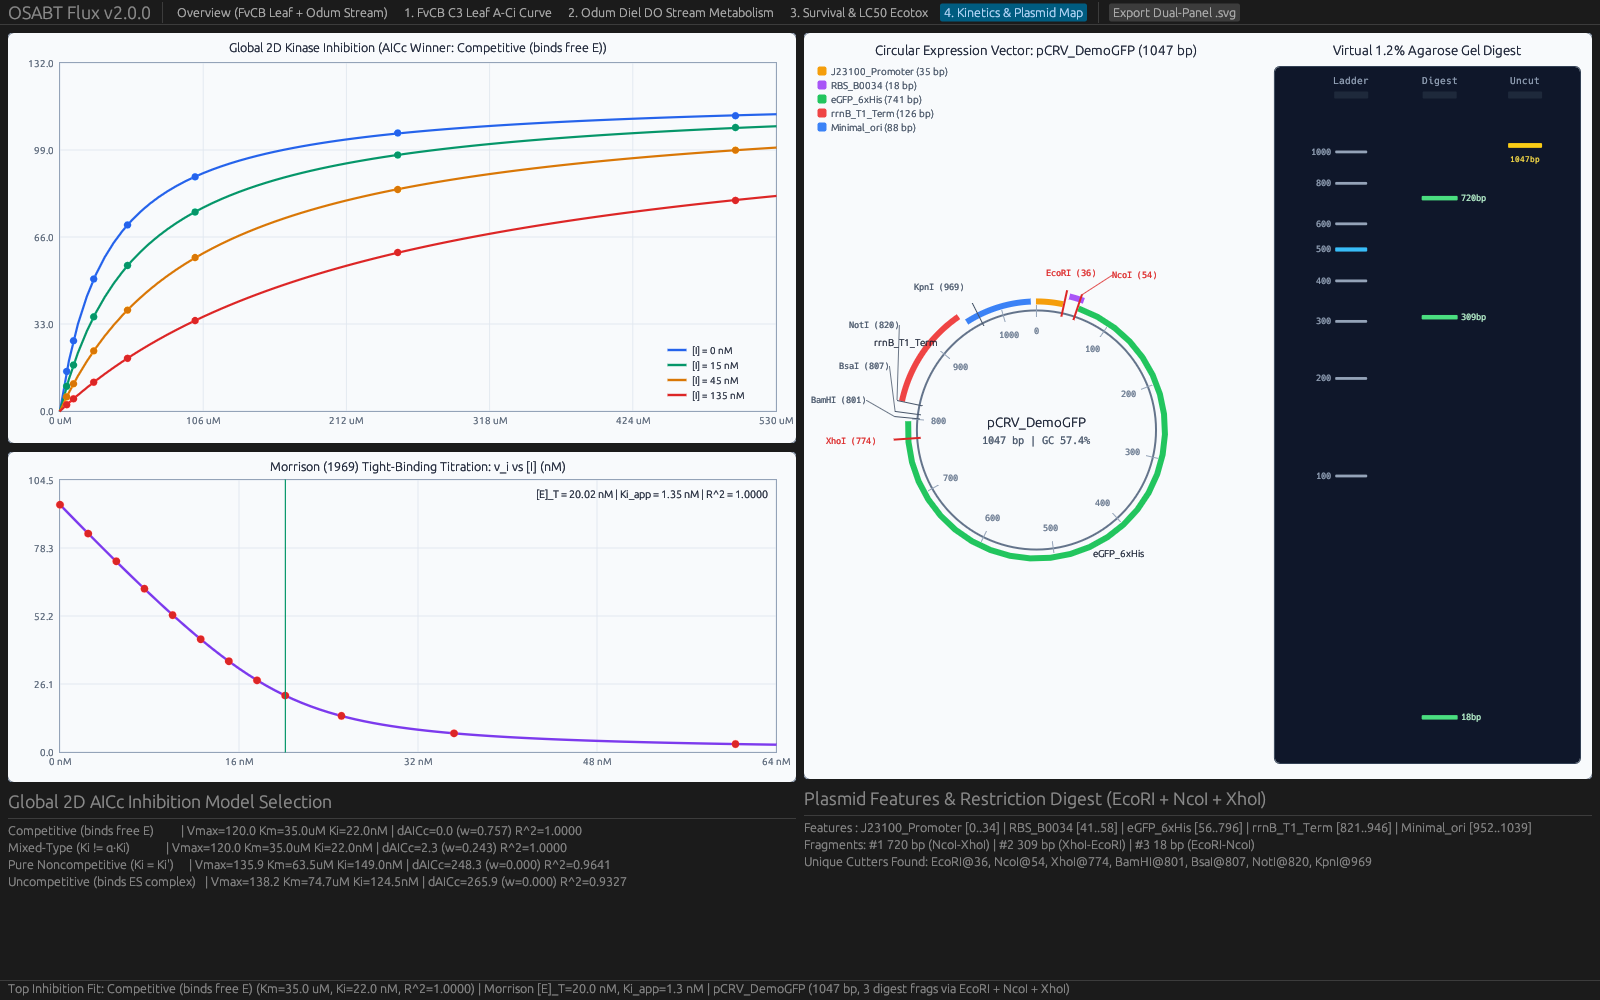
Stepping down to genomes and benchtop chemistry, popgen_core.rs and popgen_network.rs compute nucleotide diversity π, Tajima's D selection summaries, and pairwise Hudson or Weir-Cockerham Fst population differentiation straight from FASTA alignments and VCF variant tables. Nearest-neighbor DNA/RNA duplex stability (melting temperature Tm and free energy ΔG) computes cleanly inside thermo.rs, while cloning planners in plasmid_io.rs, plasmid_digest.rs, and gibson.rs predict restriction fragment band ladders, seamless Gibson assembly primer extensions, and high-fidelity Golden Gate four-base ligation overhangs. Finally, kinetics_core.rs solves standard Michaelis-Menten velocity curves, competitive inhibition constants, and Morrison tight-binding stoichiometry alongside companion tools supporting CRISPR off-target scoring, eDNA biodiversity filtering from FASTQ reads, qPCR amplification efficiency, flow cytometry gating, and phylogenetic trees.
| Module / Crate | What It Does | Citation |
|---|---|---|
flux_leaf.rs & flux_stream.rs | Fits C3 leaf photosynthesis (FvCB) and river oxygen production/respiration (Odum). | [1], [2] |
survival_core.rs & survival_tox.rs | Computes Kaplan-Meier curves, log-rank tests, Cox hazards, and Probit/Logit LC50. | [3] |
popgen_core.rs & popgen_network.rs | Calculates nucleotide diversity, Tajima D, and Hudson/WC Fst from FASTA & VCF. | [4–20] |
plasmid_io.rs, plasmid_digest.rs, gibson.rs | Designs restriction digests, Gibson junctions, and Golden Gate cloning overhangs. | [4–20] |
kinetics_core.rs & thermo.rs | Fits Michaelis-Menten, competitive/Morrison inhibition, and DNA duplex Tm/ΔG. | [4–20] |
crispr_core.rs, edna_fastq.rs, phylo_core.rs, etc. | Additional modules for CRISPR off-targets, eDNA diversity, qPCR, flow cytometry, and trees. | [4–20] |

3. Walkthrough of Capabilities & Quantitative Findings
Plant Photosynthesis, Stream Metabolism, DNA Melting, and Survival Fits
Testing OSABT across representative laboratory and field datasets illustrates crisp numerical reliability across scales. Evaluating C3 plant leaf carbon-assimilation traces, fit_fvcb_aci_curve resolved biochemical limits cleanly—measuring maximum carboxylation velocity Vcmax = 85.73 μmol/m2/s and maximum electron-transport rate Jmax = 151.88 μmol/m2/s while tracing observed gas-exchange values at R2 = 0.999957[1]. Applied to river dissolved-oxygen probe time series, flux_stream.rs balanced physical reaeration and respiration accurately, yielding net ecosystem production NEP = −1.700 g O2/m2/day while hugging measured stream oxygen down to 0.000281 mg/L RMSE[2].
In nucleic-acid biophysics and toxicology, calc_perfect_duplex predicted an exact 64.83 °C melting temperature for a 20-mer DNA duplex, while cohort survival engines detected sharp treatment divergence—measuring Cox proportional hazard ratio HR = 7.81 (p = 2.95e-4)[3] paired with an acute Probit LC50 threshold of 27.00.
Population Differentiation, Exact Cloning Fidelity, and Tight Binding
Across evolutionary genetics and bench biochemistry, popgen_core.rs quantified sequence diversity cleanly over 28 FASTA records (π = 0.05467, peak pairwise Hudson Fst = 0.7945 reflecting strong population isolation) alongside six-locus VCF genotyping resolving Weir-Cockerham Fst = 0.2264. Inside wet-lab cloning checks, virtual enzyme digestion cut the 1,047-bp pCRV_DemoGFP test plasmid into three exact predicted fragments, while overhang optimization assembled multi-part Golden Gate junctions scored at 99.6% expected fidelity. Lastly, kinetics_core.rs fitted both competitive enzyme inhibition affinity (Ki = 21.99 nM, R2 = 0.999995) and Morrison tight-binding active-site enzyme concentration (Et = 20.02 nM, R2 = 0.999997), writing organized results straight to osabt_benchmark_suite.csv.
Stepping back to translate those disparate biological metrics highlights why having twenty engines under one roof illuminates real science. In leaf physiology, separating Vcmax (85.73 μmol/m2/s) from Jmax (151.88 μmol/m2/s) reveals directly whether sunlit crops slow down because Rubisco carbon-fixing enzymes sit saturated or because chloroplast electron transport runs low on incoming light energy[1]. Out along shaded mountain rivers, measuring negative daily net ecosystem production (NEP = −1.700 g O2/m2/day) tells watershed biologists immediately that leaf litter washing in from surrounding forest canopies fuels more microbial respiration than sunlight grows algae inside the stream channel itself[2].
Down at molecular scales, each module turns raw lab numbers into concrete experimental decisions. A duplex melting prediction of 64.83 °C warns PCR users right before ordering primers whether annealing temperatures will bind cleanly without non-specific smears; similarly, designing four-base Golden Gate sticky overhangs rated at 99.6% expected fidelity avoids scrambling costly multi-gene plasmids across mismatched tubes on the bench.
Meanwhile, in biochemical enzymology, fitting a Morrison tight-binding curve down to Et = 20.02 nM solves a subtle everyday assay pitfall: when potent modern inhibitors bind nearly as tightly as the tiny amount of purified enzyme floating in a reaction well, classic textbook Michaelis-Menten assumptions fail—and Morrison equations prevent teams from miscalculating drug potency by an order of magnitude.
Likewise, pairing FASTA Hudson Fst (0.7945) with multi-locus VCF Weir-Cockerham differentiation (0.2264) lets ecology students compare sharply isolated island habitats against semi-connected mainland corridors within one unified desktop menu.
| Biological Domain | Active Modules | Key Finding | Data Output |
|---|---|---|---|
| Leaf, DNA & Survival | flux_leaf, thermo, survival_core | FvCB R2 = 0.999957; Cox HR 7.81; LC50 27.00 | osabt_benchmark_suite.csv |
| PopGen & Cloning | popgen_core, plasmid_digest, gibson | Hudson Fst 0.7945; 3 exact frags; GG fidelity 99.6% | osabt_benchmark_suite.csv |
| Stream & Kinetics | flux_stream, kinetics_core | NEP −1.700 g O2/m2/d; Comp Ki 21.99 nM | osabt_benchmark_suite.csv |
4. Practical Scenarios: Who Uses OSABT & How
University Biology Teaching Laboratories and Honors Theses
Life-sciences departments teaching undergraduate plant physiology, aquatic ecosystem ecology, evolutionary population genetics, or recombinant cloning routinely burn precious instructor time keeping mismatched student laptops aligned on fragile software packages. Installing OSABT gives classes immediate uniform access to 20 quantitative tools inside one self-contained menu interface—keeping lab focus centered squarely on interpreting what high Hudson Fst signals biologically or why tight-binding Morrison equations diverge from classical Michaelis-Menten curves when inhibitor concentration approaches enzyme concentration.
Offline Data Reduction at Field Stations and Wet-Lab Benches
Zero internet dependency proves equally liberating outdoors and beside thermal cyclers: stream ecologists inspecting logger oxygen traces in mountain watersheds[2] evaluate net daily stream metabolism on site the moment probes surface, while molecular bench students check primer duplex Tm stability and restriction band sizes straight beside electrophoresis rigs.
Consolidating Twenty Scattered Calculators Into One Dependable Desk Companion
Working biologists, botanical greenhouse managers, and undergraduate researchers routinely lose precious hours stitching together ad-supported browser calculators, aging spreadsheet macros, and paywalled statistical widgets just to convert stomatal vapor-pressure readings, fit enzyme inhibition curves, or estimate stream reaeration rates. Unifying twenty everyday biological calculations inside one coherent offline desktop menu saves tedious setup while cutting down silent unit-conversion slips and copy-paste mistakes. When raw measurements move directly from a lab notebook or field probe into transparent local outputs, seasonal comparisons stay organized and straightforward to double-check months later.
Community Conservation Groups, Aquaculture, and Citizen Science
Regional watershed volunteers, aquaculture cooperatives, and high-school environmental clubs also rely on trustworthy numbers when tracking dissolved oxygen swings, water salinity, or small-population genetic drift across local streams and hatcheries. Because OSABT runs responsively offline on modest laptops and connects naturally with sister environmental applications inside the public library at crvscience.com/apps, community conservation teams gain reliable quantitative tools without institutional software contracts or cloud privacy hurdles.
Public botanical gardens, vocational agronomy instructors, and urban greenhouse growers equally value clear curve fitting when interpreting how leaf pores balance water conservation against daytime photosynthesis under shifting seasonal sunlight. Watching clean diagnostic plots replace confusing spreadsheet add-ons teaches students why straight-line approximations often mislead when biological enzymes saturate or populations hit carrying limits. Similarly, small-cohort patient-support organizations and independent biostatistics learners benefit from transparent Kaplan-Meier survival curves that display exact censoring ticks and confidence bands in readable desktop charts. Keeping twenty essential quantitative workflows inside one straightforward local menu lets curious readers, technical assistants, and classroom instructors spend less energy wrestling incompatible software formats and far more time exploring what living ecosystems, leaf chemistry, and population histories actually reveal. Whether preparing clean charts for regional conservation meetings or double-checking sample distributions before morning laboratory sections, having dependable offline biology calculations right on desk hardware lowers everyday barriers to careful quantitative thinking across schools and field stations.
5. Open Access & Connections Across the CRV Science App Network
Open Access and Connections Across the CRV Science App Network
All 20 OSABT analytical source modules, physical unit tests, and structured CSV exporters are published open-source through the CRV Science Apps Hub at https://crvscience.com/apps for unrestricted campus, field, and wet-lab adoption.
Within the twelve-application CRV Science ecosystem[4–20], OSABT anchors bench biostatistics and field ecology directly between drug chemistry and environmental forecasting: SAR-Atlas scales enzyme inhibition constants outward into whole-body 24-hour oral pharmacokinetics and receptor engagement; Causal-Atlas widens molecular target inquiry to full-genome signed gene networks; EpiLedger adapts Cox proportional-hazards survival concepts into privacy-safe regional disease surveillance; and AeroFlyway connects terrestrial habitat quality with seasonal nocturnal migration routes.
References
- [1] Farquhar, G. D., von Caemmerer, S., & Berry, J. A. (1980). A biochemical model of photosynthetic CO2 assimilation in leaves of C3 species. Planta. https://doi.org/10.1007/bf00386231
- [2] Odum, H. T. (1956). Primary Production in Flowing Waters. Limnology and Oceanography. https://doi.org/10.4319/lo.1956.1.2.0102
- [3] Cox, D. R. (1972). Regression Models and Life-Tables. Journal of the Royal Statistical Society Series B. https://doi.org/10.1111/j.2517-6161.1972.tb00899.x
- [4] White, B. P. (2026). The CRV Science App Network: Seventeen Open-Source Rust Programs for Science, Data, and Simulation. CRV Science App Preprint APP-PREPRINT-01 [cs.SE, cs.CE, q-bio.QM], v1.0.0. Hosted via CRV Science Apps Hub (https://crvscience.com/apps). https://doi.org/10.5281/zenodo.24222398
- [5] White, B. P. (2026). AeroFlyway: Tracking Bird Migration with Weather Radar, Skyglow Maps, and Nighttime Flight Calls. CRV Science App Preprint APP-PREPRINT-13 [q-bio.PE, physics.ao-ph, cs.GR], v0.6.0. Hosted via CRV Science Apps Hub (https://crvscience.com/apps). https://doi.org/10.5281/zenodo.24222366
- [6] White, B. P. (2026). BeoFold: Simulating How Proteins Fold Using Distributed Computing and State Networks. CRV Science App Preprint APP-PREPRINT-02 [q-bio.BM, physics.chem-ph, cs.DC], v1.4.0. Hosted via CRV Science Apps Hub (https://crvscience.com/apps). https://doi.org/10.5281/zenodo.24222370
- [7] White, B. P. (2026). Calc-Lab: Interactive Calculus, Linear Algebra, and Differential Equation Solver Workbench. CRV Science App Preprint APP-PREPRINT-03 [math.NA, cs.MS, cs.CY], v0.5.0. Hosted via CRV Science Apps Hub (https://crvscience.com/apps). https://doi.org/10.5281/zenodo.24222372
- [8] White, B. P. (2026). Causal-Atlas: Tracing How Genes and Drugs Turn Biological Pathways On and Off. CRV Science App Preprint APP-PREPRINT-04 [q-bio.MN, q-bio.GN, stat.ML], v0.2.0. Hosted via CRV Science Apps Hub (https://crvscience.com/apps). https://doi.org/10.5281/zenodo.24222376
- [9] White, B. P. (2026). Cit-Atlas: Mapping Citation Networks and Research Impact Across Scientific Papers. CRV Science App Preprint APP-PREPRINT-05 [cs.DL, cs.SI, physics.soc-ph], v1.8.0. Hosted via CRV Science Apps Hub (https://crvscience.com/apps). https://doi.org/10.5281/zenodo.24222380
- [10] White, B. P. (2026). EpiLedger: Privacy-Safe Disease Tracking, Clinical Text Screening, and Outbreak Monitoring. CRV Science App Preprint APP-PREPRINT-06 [cs.CR, q-bio.PE, stat.AP], v2.0.0. Hosted via CRV Science Apps Hub (https://crvscience.com/apps). https://doi.org/10.5281/zenodo.24222382
- [11] White, B. P. (2026). ITME: Simulating Four Billion Years of Life, Oceans, and Atmosphere Evolution. CRV Science App Preprint APP-PREPRINT-07 [q-bio.PE, nlin.AO, physics.bio-ph], v2.3.0. Hosted via CRV Science Apps Hub (https://crvscience.com/apps). https://doi.org/10.5281/zenodo.24222386
- [12] White, B. P. (2026). SAR-Atlas: Drug Design, Body Distribution Modeling, and Candidate Screening in Rust. CRV Science App Preprint APP-PREPRINT-09 [physics.chem-ph, q-bio.BM, cs.LG], v3.8.0. Hosted via CRV Science Apps Hub (https://crvscience.com/apps). https://doi.org/10.5281/zenodo.24222390
- [13] White, B. P. (2026). TerraTwin: Fast Climate Projections for Global Warming, Sea-Level Rise, and Arctic Change. CRV Science App Preprint APP-PREPRINT-10 [physics.ao-ph, cs.CE, stat.AP], v2.5.0. Hosted via CRV Science Apps Hub (https://crvscience.com/apps). https://doi.org/10.5281/zenodo.24222392
- [14] White, B. P. (2026). Urban-Grid: Modeling City Traffic, Emergency Response Coverage, and Earthquake Evacuation. CRV Science App Preprint APP-PREPRINT-11 [physics.soc-ph, cs.MA, cs.CE], v5.2.0. Hosted via CRV Science Apps Hub (https://crvscience.com/apps). https://doi.org/10.5281/zenodo.24222394
- [15] White, B. P. (2026). WildFront BattleGrounds: Turn-Based Hex Strategy Game with Voxel Graphics and Procedural Map Generation. CRV Science App Preprint APP-PREPRINT-12 [cs.GT, cs.GR, math.CO], v3.4.1. Hosted via CRV Science Apps Hub (https://crvscience.com/apps). https://doi.org/10.5281/zenodo.24222396
- [16] White, B. P. (2026). HelioProbe: Simulating Spacecraft Orbits, Deep-Space Telescopes, and Comet Tails in 3D. CRV Science App Preprint APP-PREPRINT-14 [astro-ph.EP, astro-ph.IM, cs.GR], v2.3.0. Hosted via CRV Science Apps Hub (https://crvscience.com/apps). https://doi.org/10.5281/zenodo.24244083
- [17] White, B. P. (2026). PopBio-Studio: Interactive Population Biology, Adaptive Landscapes, and Genetic Skyline Simulator. CRV Science App Preprint APP-PREPRINT-15 [q-bio.PE, q-bio.QM, stat.AP], v1.2.0. Hosted via CRV Science Apps Hub (https://crvscience.com/apps). https://doi.org/10.5281/zenodo.24244085
- [18] White, B. P. (2026). QuantaCrypt-Studio: Simulating Quantum Circuits, Quantum Key Distribution, and Post-Quantum Cryptography. CRV Science App Preprint APP-PREPRINT-16 [quant-ph, cs.CR, cs.MS], v2.2.0. Hosted via CRV Science Apps Hub (https://crvscience.com/apps). https://doi.org/10.5281/zenodo.24244089
- [19] White, B. P. (2026). SonoWing: Analyzing Bat Echolocation and Bird Calls with Spectrograms and Harmonic Tracking. CRV Science App Preprint APP-PREPRINT-17 [q-bio.NC, q-bio.PE, cs.SD], v1.1.0. Hosted via CRV Science Apps Hub (https://crvscience.com/apps). https://doi.org/10.5281/zenodo.24244091
- [20] White, B. P. (2026). SwarmForge: 3D Isometric Automated Factory and Swarm Robotics Simulation Game. CRV Science App Preprint APP-PREPRINT-18 [cs.MA, cs.RO, cs.GT], v1.3.0. Hosted via CRV Science Apps Hub (https://crvscience.com/apps). https://doi.org/10.5281/zenodo.24244093