Overview
TerraTwin (v2.5.0) is an interactive desktop Earth-system simulator designed to help educators, students, coastal resilience teams, and policy readers explore how 21st-century energy and emissions decisions shape global warming, sea-level rise, extreme heat stress, and polar warming from 1950 through 2100. Full three-dimensional supercomputer climate models reproduce remarkable atmospheric detail yet demand days or weeks per trajectory—far too slow for interactive classroom comparisons. TerraTwin translates established radiative forcing physics and ocean thermal inertia into a fast coupled Earth model executing smoothly across all four canonical Shared Socioeconomic Pathway (SSP) emissions trajectories in milliseconds. Across continuous 151-year projections, year-2100 warming spans +1.530 °C under rapid mitigation (SSP1-1.9) to +5.558 °C under fossil-heavy growth (SSP5-8.5), while 0–2,000 m ocean thermal expansion pushes sea-level rise from 15.84 cm to 112.20 cm, coastal storm surges climb from 1.311 m to 2.054 m, and high-northern Arctic warming outpaces tropical warming by 2.51x to 2.56x. Source code, documentation, and companion apps are listed at https://crvscience.com/apps.
1. Real-World Context & Why This Problem Matters
Why Fast, Inspectable Climate Simulators Matter
Public discussions surrounding 21st-century climate choices frequently orbit simple global milestones—holding planetary warming near +1.5 °C versus drifting above +3 °C or +4 °C—yet high-schoolers, community planners, and everyday readers rarely obtain immediate hands-on intuition explaining why energy choices unfolding over the coming twenty years govern ocean tides, coastal flooding, and extreme summer heat stress through 2100 and beyond. International climate science organizes alternative socioeconomic futures cleanly into Shared Socioeconomic Pathways (SSPs): tracing paths from rapid clean-energy cooperation (SSP1-1.9) and moderate continuation growth (SSP2-4.5) up through regional rivalry (SSP3-7.0) and unmitigated fossil-intensive development (SSP5-8.5)[2].
Translating greenhouse emissions cleanly into surface impacts relies on two intuitive physical mechanisms operating together across timescales. First, accumulating carbon dioxide and trace gases intercept outgoing infrared warmth in clear step with radiative forcing scaling[1]. Second, Earth's vast oceans behave like a colossal thermal flywheel: oceans absorb over 90% of trapped surplus heat across mixed surface waters and deep basins reaching 2,000 meters, slowly swelling physically as water warms to drive lasting sea-level rise while retreating high-latitude snow and sea ice absorb extra sunlight—amplifying Arctic coastal warming steadily above tropical oceans[3]. Full supercomputer fluid models take weeks per experiment, whereas classrooms and town halls require millisecond-fast, inspectable interactivity.
2. Conceptual Design & How TerraTwin Works
Coupled Energy-Balance Physics and Zonal Impact Layers
TerraTwin (v2.5.0) pairs a coupled planetary energy-balance solver (physics.rs) cleanly with historical and future greenhouse-gas pathways (ingest.rs and interp.rs) inside a single native Rust desktop application executing full 151-year trajectories instantaneously. Launching smoothly from verified 1950 post-war climate conditions and stepping cleanly each year through 2100, the physical solver computes radiative heat imbalance from CO2 and companion greenhouse gases via established IPCC scaling[1][2] and routes incoming heat dynamically between land-air anomalies, sunlit ocean mixed layers, and deep 0–2,000 m ocean heat storage.
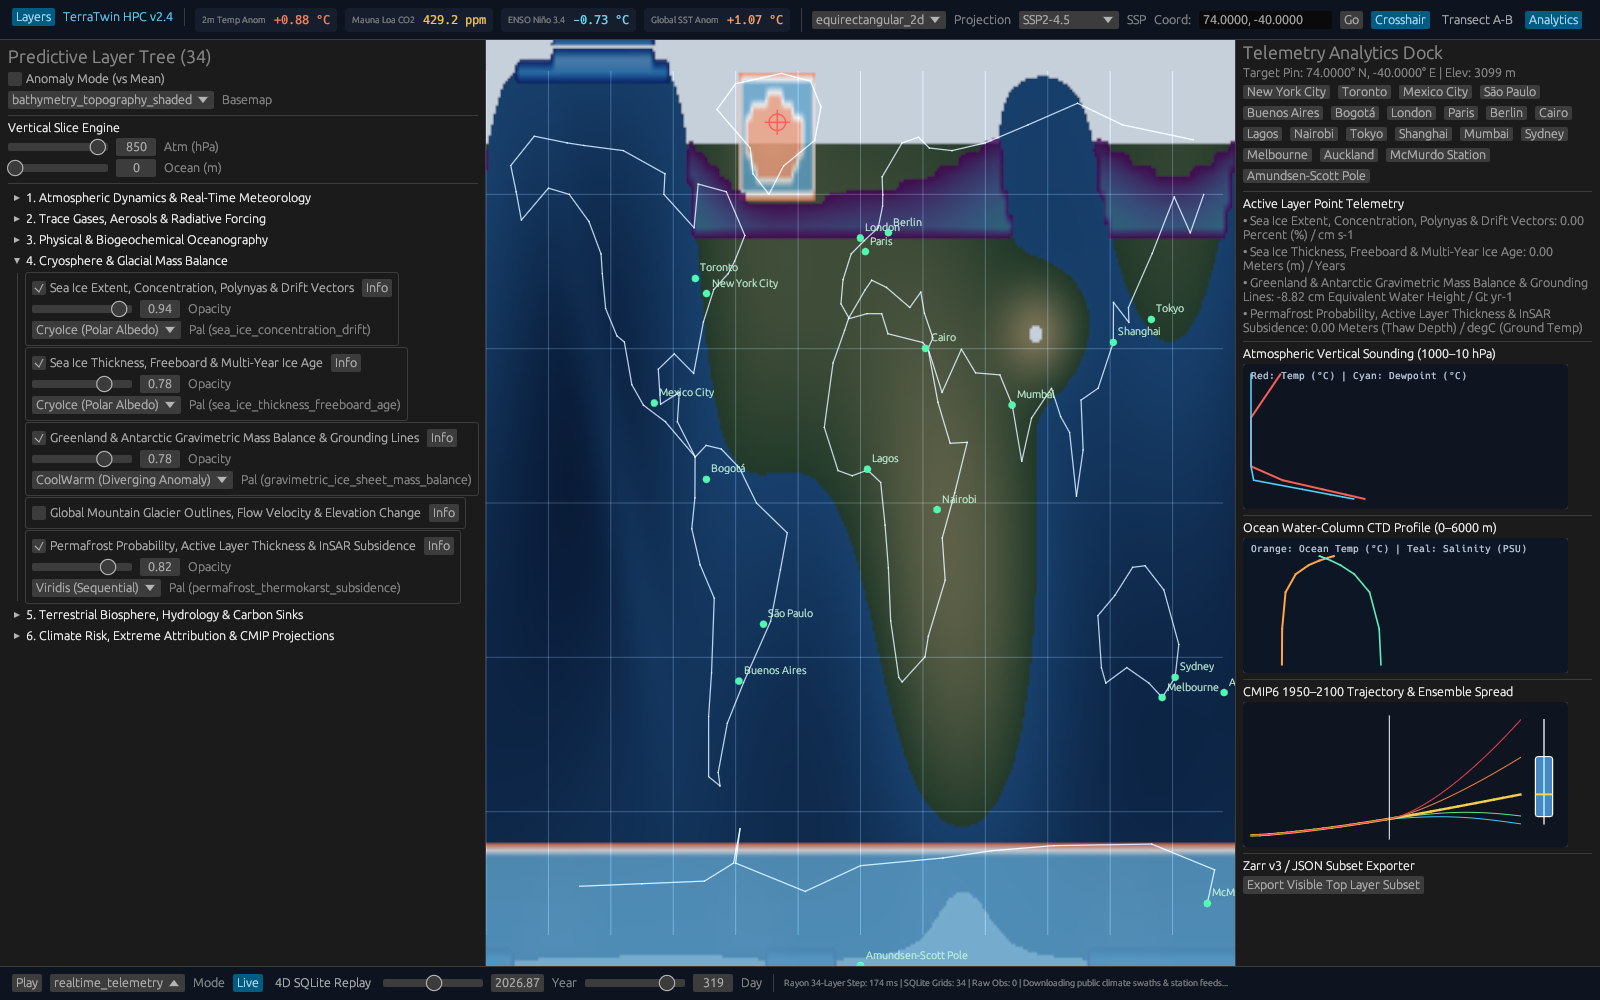
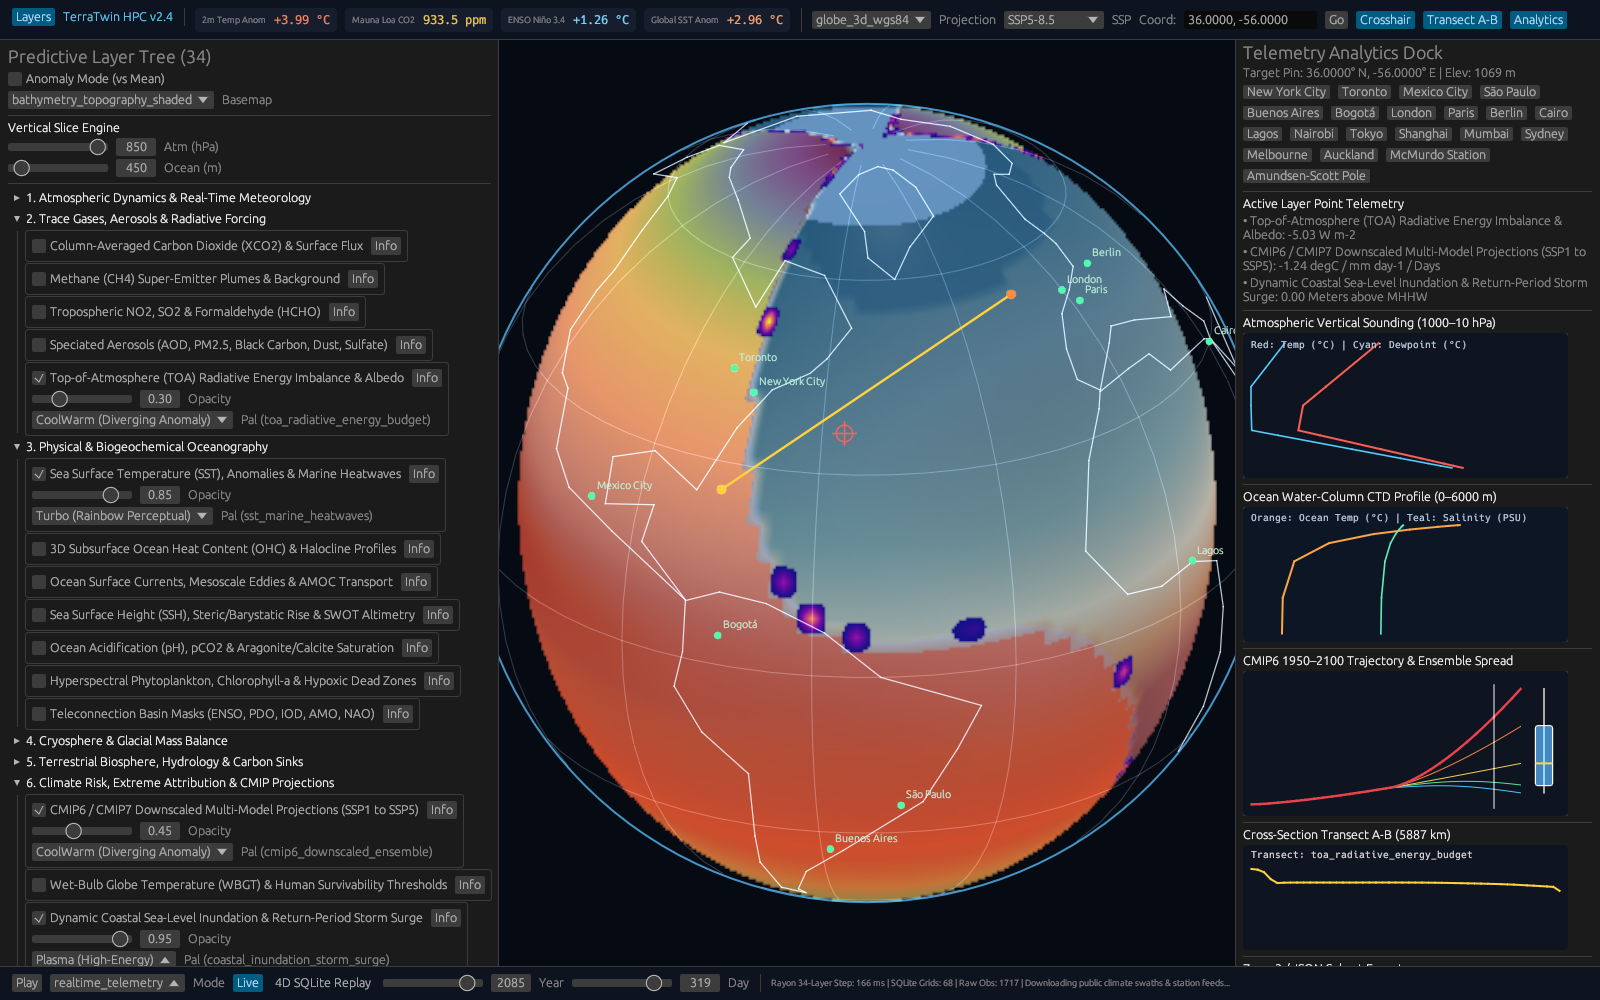
Rather than displaying merely one bare global mean thermometer chart, physics.rs projects 34 coordinated annual telemetry layers simultaneously: global average temperature anomaly, polar versus equatorial latitude gradients, Arctic sea-ice retreat, 0–2,000 m thermosteric sea-level rise, shifting coastal extreme storm-surge baselines, outdoor humid wet-bulb heat stress exceedance thresholds, and regional wildfire weather risk indexes.
Fluid World Mapping and Local Scenario Storage
To ensure live timeline scrubbing remains butter-smooth even on lightweight school laptops, TerraTwin isolates physics integration onto an asynchronous worker thread (worker.rs) while geographic rendering code (coastlines.rs, colormaps.rs, gui.rs, main.rs) paints evolving world temperature bands and retreating ice caps continuously in real time. Complete multi-decade trajectories persist reliably inside local storage (db.rs, schema.rs) and export into tidy comma-separated spreadsheets (ssp_projections_1950_2100.csv) ready for independent student analysis or coastal resilience planning.
| Module / Crate | What It Does | Citation |
|---|---|---|
physics.rs | Computes greenhouse forcing, ocean heat uptake, sea-level rise, sea ice, and heat stress. | [1], [2], [3] |
ingest.rs & interp.rs | Loads 1950–2100 SSP gas pathways and interpolates 5-year and regional fields. | [2] |
coastlines.rs & colormaps.rs | Draws world map coastlines and climate anomaly color scales. | [4–20] |
db.rs & schema.rs | Saves 34 telemetry layers and scenario snapshots locally. | [4–20] |
gui.rs, worker.rs, main.rs | Desktop map viewer and background simulation worker thread. | [4–20] |

3. Walkthrough of Capabilities & Quantitative Findings
Four Diverging Warming Pathways Across 1950–2100
Starting from a common historical 1950 baseline global anomaly of +0.613 °C relative to pre-industrial norms, TerraTwin exposes with crisp numerical clarity how sharply energy trajectories separate mid-to-late-century outcomes by 2100[2]. Under strong rapid decarbonization (SSP1-1.9), atmospheric CO2 peaks early and softens down to 393 ppm by 2100 at 1.852 W/m2 net forcing, settling global warming gently at +1.530 °C. Under middle-of-the-road policy continuation (SSP2-4.5), 2100 CO2 rises to 603 ppm (4.142 W/m2 forcing) and warming more than doubles to +3.152 °C. Higher-emission trajectories escalate planetary heat steadily further: SSP3-7.0 hits 867 ppm CO2 (6.085 W/m2, +4.536 °C), while fossil-heavy SSP5-8.5 pushes CO2 to 1,135 ppm and 7.526 W/m2 forcing—driving global surface average warming up to +5.558 °C.
Ocean Thermal Inertia, Sea-Level Rise, and Polar Amplification
Inspecting 0–2,000 m ocean heat expansion demonstrates why deep-water inertia locks in multi-decade coastal risk long after peak emissions: thermosteric sea-level rise spans more than a seven-fold gap by 2100, climbing smoothly from 15.84 cm under SSP1-1.9 to 54.72 cm (SSP2-4.5), 87.72 cm (SSP3-7.0), and 112.20 cm under SSP5-8.5. Elevated background sea levels raise extreme storm-surge waterlines accordingly from 1.311 m up toward 2.054 m—turning rare coastal floods into chronic high-tide infrastructure stress.
Across latitude belts, reflective ice loss amplifies high-northern heating steadily[3]: latitudes poleward of 66.5° N jump +5.91 °C (SSP2-4.5), +8.67 °C (SSP3-7.0), and +10.72 °C (SSP5-8.5) compared with +2.36 °C, +3.41 °C, and +4.19 °C across tropical belts—reproducing crisp 2.51x to 2.56x Arctic polar amplification ratios effortlessly offline.
Understanding why ocean thermal expansion keeps creeping upward even under rapid decarbonization solves one of the most frequent public questions about climate science. Imagine warming a giant kettle of water on a kitchen stove and snapping the burner down from high to simmer: steam droplets atop the lid settle quickly, yet heat already soaking downward continues warming the full pot depth for minutes afterward. Earth's oceans measure kilometers deep and hold vast thermal mass; even as SSP1-1.9 stabilizes surface air temperatures near +1.530 °C, heat already moving downward from 0 to 2,000 meters expands water density gently across decades—adding 15.84 cm of baseline rise cleanly under mitigation while uncurbed pathways push thermosteric rise past one full meter alongside melting land ice sheets.
Equally striking in real human terms, translating an extra +0.74 m jump in coastal storm-surge waterline (1.311 m up to 2.054 m) clarifies why municipal engineers worry less about gentle average tides than extreme autumn cyclones or winter king tides riding atop higher seas. Every decimeter of baseline ocean swell allows ordinary coastal storm winds to push water markedly farther past existing seawalls, road causeways, and saltwater treatment stations. Meanwhile, the steady 2.51x–2.56x Arctic warming multiplier mirrors bright snow and white sea ice melting away to uncover dark ocean water—absorbing sunlight that previously bounced cleanly back into space[3] and accelerating northern permafrost thaw well beyond global averages.
Comparing all four Shared Socioeconomic Pathways side by side also helps non-specialists appreciate why near-term energy choices yield massive dividends later this century. Although global temperatures in 2030 appear deceptively close across scenarios because built-up greenhouse inertia takes decades to express fully, divergence accelerates rapidly between 2050 and 2100—turning the gap between SSP1-1.9 (+1.530 °C) and SSP5-8.5 (+5.558 °C) into the difference between manageable adaptation and pervasive coastal, agricultural, and wet-bulb heat disruptions[2].
| Emissions Pathway | 2100 CO2 & Forcing | Warming, Sea Level & Arctic Ratio | Data Output |
|---|---|---|---|
| SSP1-1.9 (Low) | 393 ppm | 1.852 W/m2 | +1.53 °C; SLR 15.84 cm | ssp_projections_1950_2100.csv |
| SSP2-4.5 (Medium) | 603 ppm | 4.142 W/m2 | +3.15 °C; SLR 54.72 cm; Arctic 2.51x tropics | ssp_projections_1950_2100.csv |
| SSP3-7.0 (High) | 867 ppm | 6.085 W/m2 | +4.54 °C; SLR 87.72 cm; Arctic 2.54x tropics | ssp_projections_1950_2100.csv |
| SSP5-8.5 (Very High) | 1,135 ppm | 7.526 W/m2 | +5.56 °C; SLR 112.20 cm; Arctic 2.56x tropics | ssp_projections_1950_2100.csv |
4. Practical Scenarios: Who Uses TerraTwin & How
Earth-Science Classrooms and Student Scenario Labs
AP Environmental Science teachers, geography lecturers, and university climate instructors constantly wish students could experiment directly with radiative forcing math[1] and ocean heat inertia rather than memorizing static textbook curves. Running TerraTwin offline lets students scrub fluidly across 1950–2100 during a single seminar, inspect directly why Arctic coasts warm more than 2.5x faster than equatorial zones[3], compare heat-stress versus wildfire indices, and download clean ssp_projections_1950_2100.csv tables for structured lab exercises.
Local planners, watershed conservation boards, and science museum educators benefit equally from watching abstract global warming averages translate into neighborhood-level risk stories that ordinary residents immediately recognize. Rather than arguing over disconnected tables of parts-per-million carbon concentrations, community workshops can pull up side-by-side trajectories showing how extreme wet-bulb humidity days, multi-week agricultural soil drying, and coastal high-tide flooding respond differently depending on near-term energy choices. Because every simulation runs responsively offline on an ordinary laptop without requiring supercomputer accounts or subscription portals, civic groups and journalism classrooms can test practical adaptation questions live in town-hall discussions and export clear summary files for public handouts. Exploring TerraTwin within the open collection at crvscience.com/apps connects global climate physics directly to local adaptation planning in plain, verifiable language.
Municipal infrastructure engineers, agricultural extension officers, and regional forestry managers likewise benefit from viewing regional heat trends, soil drought persistence, and coastal high-tide projections plotted side by side rather than locked inside costly consulting portals. Comparing pathways live during county planning workshops builds intuitive fluency around physical time lags—showing concretely why deep ocean inertia makes coastal sea-level commitment unfold slowly while rapid emissions choices bend mid-century heat waves much sooner. Keeping crisp projection spreadsheets stored locally helps smaller communities plan drainage upgrades, urban shade canopies, and neighborhood cooling centers responsibly using inspectable public assumptions.
Municipal Coastal Resilience and Policy Briefings
City sustainability offices, county floodplain engineers, and civic emergency managers preparing community hazard presentations can equally display TerraTwin's clear temperature trajectories, +0.74 m coastal surge range, and ocean thermal inertia plots transparently beside municipal seawall maps prior to commissioning dedicated local wave-surge modeling.
Crucially for public transparency, walking citizens through all four SSP emissions stories side by side replaces vague alarmism with concrete engineering timelines. Homeowners, port commissioners, and agriculture planners watch immediately why limiting peak warming holds sea-level rise near 15.84 cm versus committing coastal cities to over a meter of expansion under SSP5-8.5, while Arctic communities grapple directly with temperature swings warming two and a half times faster than equatorial towns.
Independent journalists and civic educators gain an equally practical desktop reference: rather than repeating rounded global averages without physical context, writers test historical post-war baselines straight through 2100 in milliseconds and confirm exactly how rising oceans and extreme heat-stress thresholds move together across continents.
5. Open Access & Connections Across the CRV Science App Network
Open Access and Connections Across the CRV Science App Network
All TerraTwin radiative physics routines, SSP pathway interpolators, map coastline graphics, and CSV scenario exporters reside publicly on the CRV Science Apps Hub at https://crvscience.com/apps for free classroom integration, civic review, and independent extension.
Within the twelve-application CRV Science ecosystem[4–20], TerraTwin acts as the contemporary planetary link connecting deep Earth evolution directly with infrastructure readiness and ecology: ITME steps backward across 4.25 billion years of biosphere-atmosphere co-evolution leading up to modern conditions; Urban-Grid stress-tests how city bridges, ambulances, and contraflow corridors cope under climate-intensified coastal surges and wildfire evacuations; AeroFlyway explores how shifting seasonal winds and temperatures intersect nocturnal songbird migration; and Calc-Lab provides direct intuition for the box differential equations storing deep ocean heat.
References
- [1] Myhre, G., et al. (1998). New estimates of radiative forcing due to well mixed greenhouse gases. Geophysical Research Letters. https://doi.org/10.1029/98gl01908
- [2] Meinshausen, M., et al. (2020). The shared socio-economic pathway (SSP) greenhouse gas concentrations and their extensions to 2500. Geoscientific Model Development. https://doi.org/10.5194/gmd-13-3571-2020
- [3] Rantanen, M., et al. (2022). The Arctic has warmed nearly four times faster than the globe since 1979. Communications Earth & Environment. https://doi.org/10.1038/s43247-022-00498-3
- [4] White, B. P. (2026). The CRV Science App Network: Seventeen Open-Source Rust Programs for Science, Data, and Simulation. CRV Science App Preprint APP-PREPRINT-01 [cs.SE, cs.CE, q-bio.QM], v1.0.0. Hosted via CRV Science Apps Hub (https://crvscience.com/apps). https://doi.org/10.5281/zenodo.24222398
- [5] White, B. P. (2026). AeroFlyway: Tracking Bird Migration with Weather Radar, Skyglow Maps, and Nighttime Flight Calls. CRV Science App Preprint APP-PREPRINT-13 [q-bio.PE, physics.ao-ph, cs.GR], v0.6.0. Hosted via CRV Science Apps Hub (https://crvscience.com/apps). https://doi.org/10.5281/zenodo.24222366
- [6] White, B. P. (2026). BeoFold: Simulating How Proteins Fold Using Distributed Computing and State Networks. CRV Science App Preprint APP-PREPRINT-02 [q-bio.BM, physics.chem-ph, cs.DC], v1.4.0. Hosted via CRV Science Apps Hub (https://crvscience.com/apps). https://doi.org/10.5281/zenodo.24222370
- [7] White, B. P. (2026). Calc-Lab: Interactive Calculus, Linear Algebra, and Differential Equation Solver Workbench. CRV Science App Preprint APP-PREPRINT-03 [math.NA, cs.MS, cs.CY], v0.5.0. Hosted via CRV Science Apps Hub (https://crvscience.com/apps). https://doi.org/10.5281/zenodo.24222372
- [8] White, B. P. (2026). Causal-Atlas: Tracing How Genes and Drugs Turn Biological Pathways On and Off. CRV Science App Preprint APP-PREPRINT-04 [q-bio.MN, q-bio.GN, stat.ML], v0.2.0. Hosted via CRV Science Apps Hub (https://crvscience.com/apps). https://doi.org/10.5281/zenodo.24222376
- [9] White, B. P. (2026). Cit-Atlas: Mapping Citation Networks and Research Impact Across Scientific Papers. CRV Science App Preprint APP-PREPRINT-05 [cs.DL, cs.SI, physics.soc-ph], v1.8.0. Hosted via CRV Science Apps Hub (https://crvscience.com/apps). https://doi.org/10.5281/zenodo.24222380
- [10] White, B. P. (2026). EpiLedger: Privacy-Safe Disease Tracking, Clinical Text Screening, and Outbreak Monitoring. CRV Science App Preprint APP-PREPRINT-06 [cs.CR, q-bio.PE, stat.AP], v2.0.0. Hosted via CRV Science Apps Hub (https://crvscience.com/apps). https://doi.org/10.5281/zenodo.24222382
- [11] White, B. P. (2026). ITME: Simulating Four Billion Years of Life, Oceans, and Atmosphere Evolution. CRV Science App Preprint APP-PREPRINT-07 [q-bio.PE, nlin.AO, physics.bio-ph], v2.3.0. Hosted via CRV Science Apps Hub (https://crvscience.com/apps). https://doi.org/10.5281/zenodo.24222386
- [12] White, B. P. (2026). OSABT: All-in-One Toolkit for Plant Physiology, Survival Curves, Genetics, and Enzyme Kinetics. CRV Science App Preprint APP-PREPRINT-08 [q-bio.QM, stat.AP, cs.SE], v2.0.0. Hosted via CRV Science Apps Hub (https://crvscience.com/apps). https://doi.org/10.5281/zenodo.24222388
- [13] White, B. P. (2026). SAR-Atlas: Drug Design, Body Distribution Modeling, and Candidate Screening in Rust. CRV Science App Preprint APP-PREPRINT-09 [physics.chem-ph, q-bio.BM, cs.LG], v3.8.0. Hosted via CRV Science Apps Hub (https://crvscience.com/apps). https://doi.org/10.5281/zenodo.24222390
- [14] White, B. P. (2026). Urban-Grid: Modeling City Traffic, Emergency Response Coverage, and Earthquake Evacuation. CRV Science App Preprint APP-PREPRINT-11 [physics.soc-ph, cs.MA, cs.CE], v5.2.0. Hosted via CRV Science Apps Hub (https://crvscience.com/apps). https://doi.org/10.5281/zenodo.24222394
- [15] White, B. P. (2026). WildFront BattleGrounds: Turn-Based Hex Strategy Game with Voxel Graphics and Procedural Map Generation. CRV Science App Preprint APP-PREPRINT-12 [cs.GT, cs.GR, math.CO], v3.4.1. Hosted via CRV Science Apps Hub (https://crvscience.com/apps). https://doi.org/10.5281/zenodo.24222396
- [16] White, B. P. (2026). HelioProbe: Simulating Spacecraft Orbits, Deep-Space Telescopes, and Comet Tails in 3D. CRV Science App Preprint APP-PREPRINT-14 [astro-ph.EP, astro-ph.IM, cs.GR], v2.3.0. Hosted via CRV Science Apps Hub (https://crvscience.com/apps). https://doi.org/10.5281/zenodo.24244083
- [17] White, B. P. (2026). PopBio-Studio: Interactive Population Biology, Adaptive Landscapes, and Genetic Skyline Simulator. CRV Science App Preprint APP-PREPRINT-15 [q-bio.PE, q-bio.QM, stat.AP], v1.2.0. Hosted via CRV Science Apps Hub (https://crvscience.com/apps). https://doi.org/10.5281/zenodo.24244085
- [18] White, B. P. (2026). QuantaCrypt-Studio: Simulating Quantum Circuits, Quantum Key Distribution, and Post-Quantum Cryptography. CRV Science App Preprint APP-PREPRINT-16 [quant-ph, cs.CR, cs.MS], v2.2.0. Hosted via CRV Science Apps Hub (https://crvscience.com/apps). https://doi.org/10.5281/zenodo.24244089
- [19] White, B. P. (2026). SonoWing: Analyzing Bat Echolocation and Bird Calls with Spectrograms and Harmonic Tracking. CRV Science App Preprint APP-PREPRINT-17 [q-bio.NC, q-bio.PE, cs.SD], v1.1.0. Hosted via CRV Science Apps Hub (https://crvscience.com/apps). https://doi.org/10.5281/zenodo.24244091
- [20] White, B. P. (2026). SwarmForge: 3D Isometric Automated Factory and Swarm Robotics Simulation Game. CRV Science App Preprint APP-PREPRINT-18 [cs.MA, cs.RO, cs.GT], v1.3.0. Hosted via CRV Science Apps Hub (https://crvscience.com/apps). https://doi.org/10.5281/zenodo.24244093