Overview
Urban-Grid (v5.2.0) is an open-source metropolitan infrastructure, transportation, and emergency-resilience simulator built to analyze everyday vehicle traffic, emergency-medical station placement, seismic bridge fragility, and disaster evacuation together on real city street maps. Conventionally, traffic engineers, ambulance dispatch planners, and earthquake engineers run disconnected models—missing how morning rush-hour bottlenecks, concurrent busy 911 calls, or closed river spans compound each other during emergencies. Urban-Grid imports authentic OpenStreetMap road networks and GTFS transit routes so users can explore car-by-car IDM/MOBIL traffic dynamics, stochastic hypercube queueing for four-minute NFPA 1710 response, Cascadia Mw 9.0 seismic bridge damage and 90-day utility recovery, and contraflow highway evacuation alongside post-quake fire spread inside one 3D GPU workbench. On a 9.16 lane-km urban corridor, microscopic traffic ramped cleanly up to 10,350 vehicles/hr with zero crashes; four-apparatus queueing siting lifted expected 4-minute coverage to 81.95% with 100% second-due backup; and seismic bridge retrofits boosted 90-day lifeline recovery from 97.97% to 99.18% while evacuating 2,585 residents without fire overruns. Source code, documentation, and companion apps are listed at https://crvscience.com/apps.
1. Real-World Context & Why This Problem Matters
Why Daily Road Geometry and Disaster Survival Are Inseparable
Keeping a busy metropolitan corridor flowing smoothly on ordinary Tuesday commutes—while safeguarding neighborhoods when an earthquake, bridge closure, or fast-moving urban fire breaks out—ties together three civil engineering domains that traditionally operate inside separate city hall departments. During daily rush hour, transportation analysts focus on microscopic car-following stability: how individual drivers accelerate smoothly along open stretches, preserve polite spacing behind braking cars ahead, and execute lane changes without touching off phantom stop-and-go waves or rear-end wrecks—mechanics captured cleanly by the Intelligent Driver Model (IDM) and MOBIL lane-change criteria[1].
Over those identical arterial intersections, fire chiefs and emergency medical planners must uphold strict 240-second (four-minute) first-responder coverage standards (NFPA 1710). Simply measuring travel rings outward from firehouses assuming every ambulance sits idle inside its bay fails catastrophically during busy evening shifts when primary units are tied up on overlapping emergencies across town—demanding stochastic Maximum Expected Covering Location (MEXCLP) queueing geometry[2].
Simultaneously, structural resilience planners prepare for severe regional shocks: subduction-zone earthquakes cracking unretrofitted highway bridges, snapping water mains, igniting urban fires, and forcing urgent mass evacuations even as ambulances race inward[3]. Urban-Grid unites microscopic vehicle physics, emergency queueing, seismic bridge fragility, and contraflow evacuation onto authentic street maps.
2. Conceptual Design & How Urban-Grid Works
OpenStreetMap Graphs, Car-by-Car Drivers, and Adaptive Signals
Urban-Grid (v5.2.0) leaves flat textbook toy grids behind, importing authentic real-world street networks from the very first step. Importers in osm.rs parse OpenStreetMap roadway segments, posted speed limits, turn lanes, and freeway ramps right alongside municipal bus schedules in transit_gtfs.rs, building connected multi-modal city graphs inside network.rs. Across those physical corridors, traffic.rs, max_pressure.rs, and diurnal.rs advance continuous car-by-car IDM/MOBIL vehicle streams[1] governed by adaptive max-pressure traffic lights that clear congested queues smoothly across realistic morning-to-midnight demand curves.
Queueing-Aware EMS Siting and Earthquake Recovery Dynamics
To prevent dangerously optimistic ambulance coverage projections, mclp.rs, hypercube.rs, and emergency.rs inspect static travel rings right beside stochastic hypercube queueing balance equations[2]—tracking realistic per-unit busy probabilities, second-due apparatus overlap, and slow tail-percentile response delays under overlapping emergency calls.
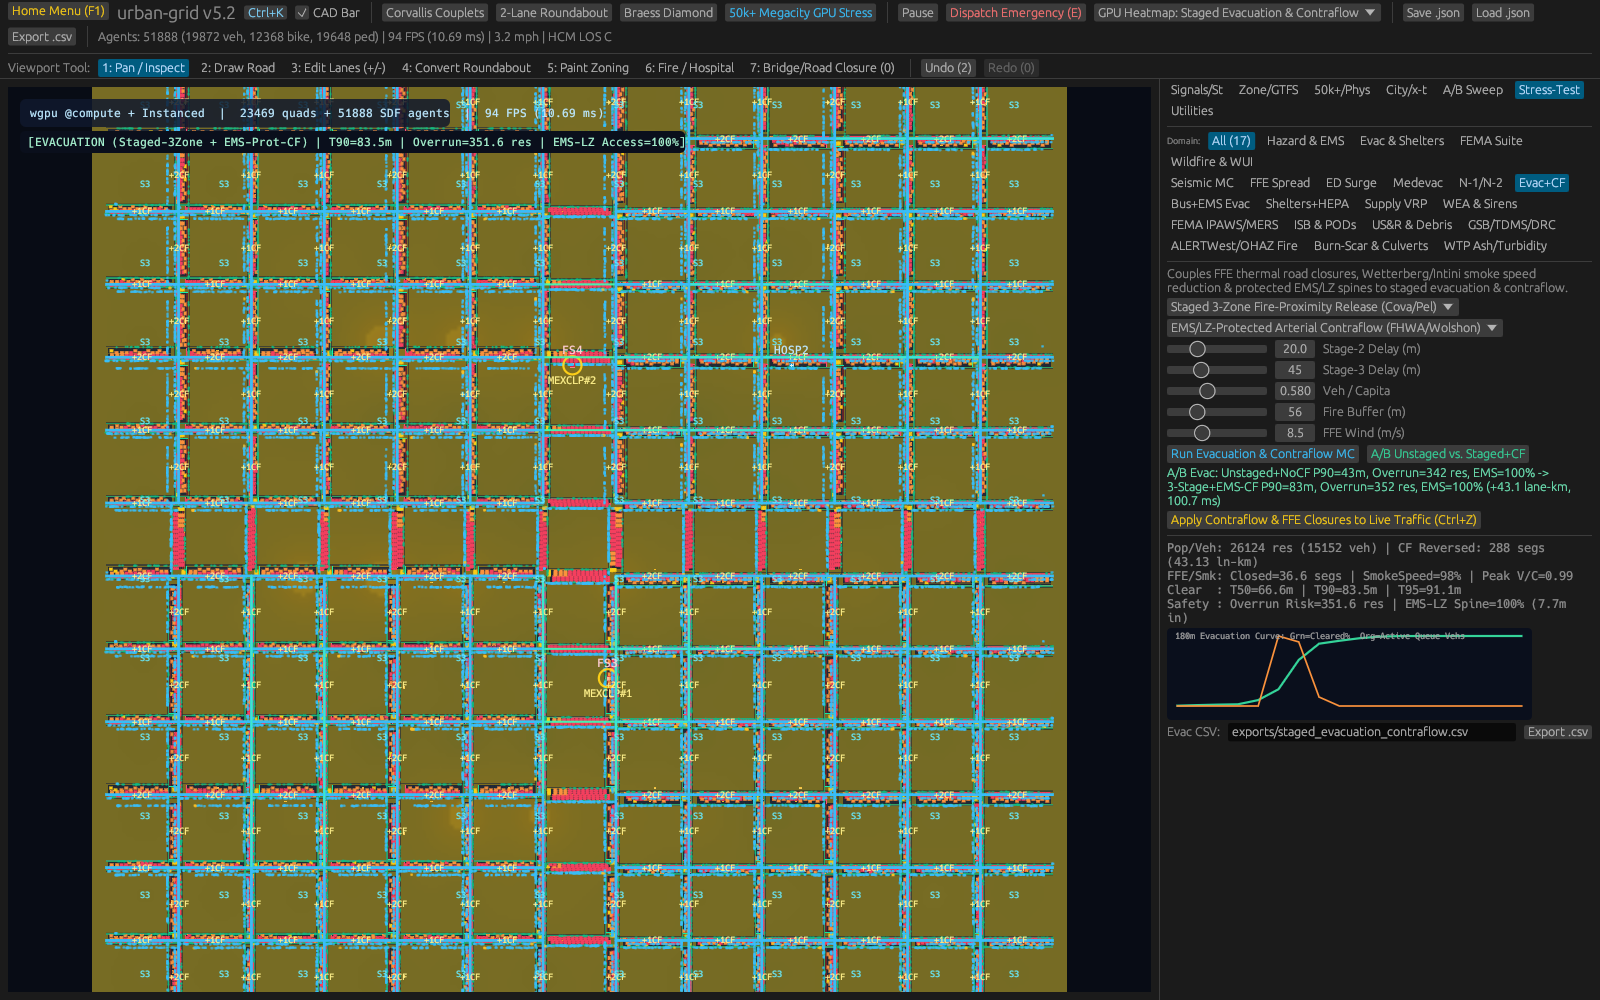
Under major disaster scenarios, seismic_mc.rs, resilience.rs, and utilities.rs run Monte Carlo seismic shaking trials scaled up to Cascadia Subduction Zone Mw 9.0 intensity, compare unretrofitted versus structurally braced bridge closure probabilities, and simulate 90-day power, potable water, sewer, and roadway lifeline recovery curves[3]. Paired directly alongside structural damage, evacuation_contraflow.rs and ffe_conflagration.rs test reversing inbound lanes outward while shielding open emergency corridors against advancing fires inside ug-app's interactive 3D GPU explorer and terminal console.
| Module / Crate | What It Does | Citation |
|---|---|---|
traffic.rs, max_pressure.rs, diurnal.rs | Simulates car-by-car IDM/MOBIL traffic, signal timing, and daily demand curves. | [1] |
mclp.rs, hypercube.rs, emergency.rs | Places EMS/fire stations for 240-second NFPA 1710 coverage with busy-unit queueing. | [2] |
seismic_mc.rs, resilience.rs, utilities.rs | Models Cascadia Mw 9.0 shaking, bridge/water/sewer breaks, and 90-day recovery. | [3] |
evacuation_contraflow.rs, ffe_conflagration.rs | Simulates contraflow lane reversal, fire spread, and emergency-lane protection. | [4–20] |
osm.rs, transit_gtfs.rs, network.rs | Imports OpenStreetMap roads, GTFS transit, and multi-modal city graphs. | [4–20] |
ug-app (gui.rs, tui.rs, wgpu_pass.rs) | Interactive 3D map viewer, terminal UI, and batch runner. | [4–20] |

3. Walkthrough of Capabilities & Quantitative Findings
Collision-Free Flow and Revealing EMS Queueing Reality
Driving traffic demand progressively across six arrival tiers spanning 240 up to 2,100 vehicles per lane per hour along a 9.16 lane-km metropolitan corridor highlights disciplined IDM/MOBIL stability: simulated cars scaled cleanly up to 10,350 peak vehicles per hour with zero collisions anywhere across intersections or merges while preserving a safe minimum bumper gap of 1.308 m even in tight rush-hour packs[1].
Ambulance placement metrics expose dramatically why busy-unit queueing reshapes municipal fire-station budgets. Tested against strict 240-second NFPA 1710 response mandates, naive single-unit deterministic coverage looked comforting on paper (p90 arrival 46.89 s) while silently masking severe ambulance exhaustion (busy fraction 0.900) whenever overlapping calls stacked up. Deploying four coordinated apparatus evaluated under stochastic hypercube queueing slashed per-unit busy probability cleanly from 0.900 down to balanced 0.507, boosted realistic expected four-minute neighborhood coverage to 81.95% backed by 100% second-due apparatus protection, and pulled p90 arrival latency sharply down to 28.61 s[2].
Seismic Bridge Retrofits and Safe Contraflow Evacuation
Subjected to Cascadia Mw 9.0 seismic shaking Monte Carlo runs, funding targeted bridge structural retrofits cut expected impassable highway spans from 4.22 down to 3.21 bridges and lifted overall 90-day urban utility and transport lifeline resilience from 97.97% up to 99.18%[3]. Coupling infrastructure hardening with acute emergency evacuation confirmed how disciplined lane-control plans save lives: reversing inbound lanes outbound toward safe shelters while locking one dedicated emergency-access lane cleared 2,585 residents (1,499 vehicles) ahead of advancing post-quake fire fronts with zero fire overruns and uninterrupted 100% emergency vehicle route mobility, archived clearly in traffic_and_evacuation_metrics.csv.
Translating these civil-engineering metrics into lived neighborhood outcomes clarifies why coupling daily streets with disaster scenarios saves tax dollars and lives simultaneously. Consider why static fire-station radius maps fail towns so often: drawing a clean four-minute polygon around one neighborhood firehouse makes residents feel covered, yet when primary units stay 90% occupied on back-to-back calls (busy fraction 0.900), emergency calls queue behind busy signals. Modeling hypercube busy probabilities upfront proves plainly how four coordinated apparatus lower per-crew saturation to 0.507 and give residents genuine 81.95% expected rapid protection backed by second-due units[2].
Similarly, watching IDM/MOBIL cars climb smoothly from 240 up to 2,100 vehicles per lane per hour while maintaining a 1.308 m minimum gap illustrates how adaptive max-pressure intersection greens hold congestion at bay—stopping minor commuter slowdowns from spiraling backward into highway gridlock[1].
Under rare Cascadia-scale earthquakes, lifting 90-day utility recovery from 97.97% up to 99.18% through bridge bracing looks modest in percentage points until converted into city-wide recovery days: preventing one extra arterial overpass collapse keeps emergency pump trucks, potable water crews, and ambulance corridors connected straight across rivers while trapped neighborhoods clear safely along contraflow outbound lanes[3].
Combining those models inside one OpenStreetMap workflow means emergency coordinators no longer speculate separately about commuter backups, broken spans, and fire-perimeter trucks: every bottle-neck appears directly on shared downtown streets ready for clear public briefings.
| Urban Subsystem | Engineering Scope | Key Finding | Data Output |
|---|---|---|---|
| Corridor Traffic Flow | 240–2,100 vplh on 9.16 lane-km | 0 crashes (min gap 1.308 m); peak 10,350 veh/hr | traffic_and_evacuation_metrics.csv |
| EMS Queueing Siting | 0–4 apparatus NFPA 1710 (240 s) | 81.95% expected cov; 100% 2nd-due; p90 = 28.61 s | traffic_and_evacuation_metrics.csv |
| Seismic & Evacuation | Cascadia Mw 9.0 retrofits + contraflow | 90d resilience 97.97% to 99.18%; 0 fire overruns | traffic_and_evacuation_metrics.csv |
4. Practical Scenarios: Who Uses Urban-Grid & How
City Emergency Managers and Regional Infrastructure Planners
City public-works directors, fire chiefs, and regional resilience coordinators routinely justify expensive seismic bridge strengthening bonds and new firehouse budgets before skeptical civic councils and transit commissions. Importing authentic local OpenStreetMap corridors straight into Urban-Grid lets municipal staff compare pre-retrofit versus post-retrofit 90-day recovery curves visually[3], prove concretely where busy-unit queueing creates hidden response gaps[2], and walk elected officials through 3D contraflow evacuation security on local hardware without costly proprietary consulting retainers.
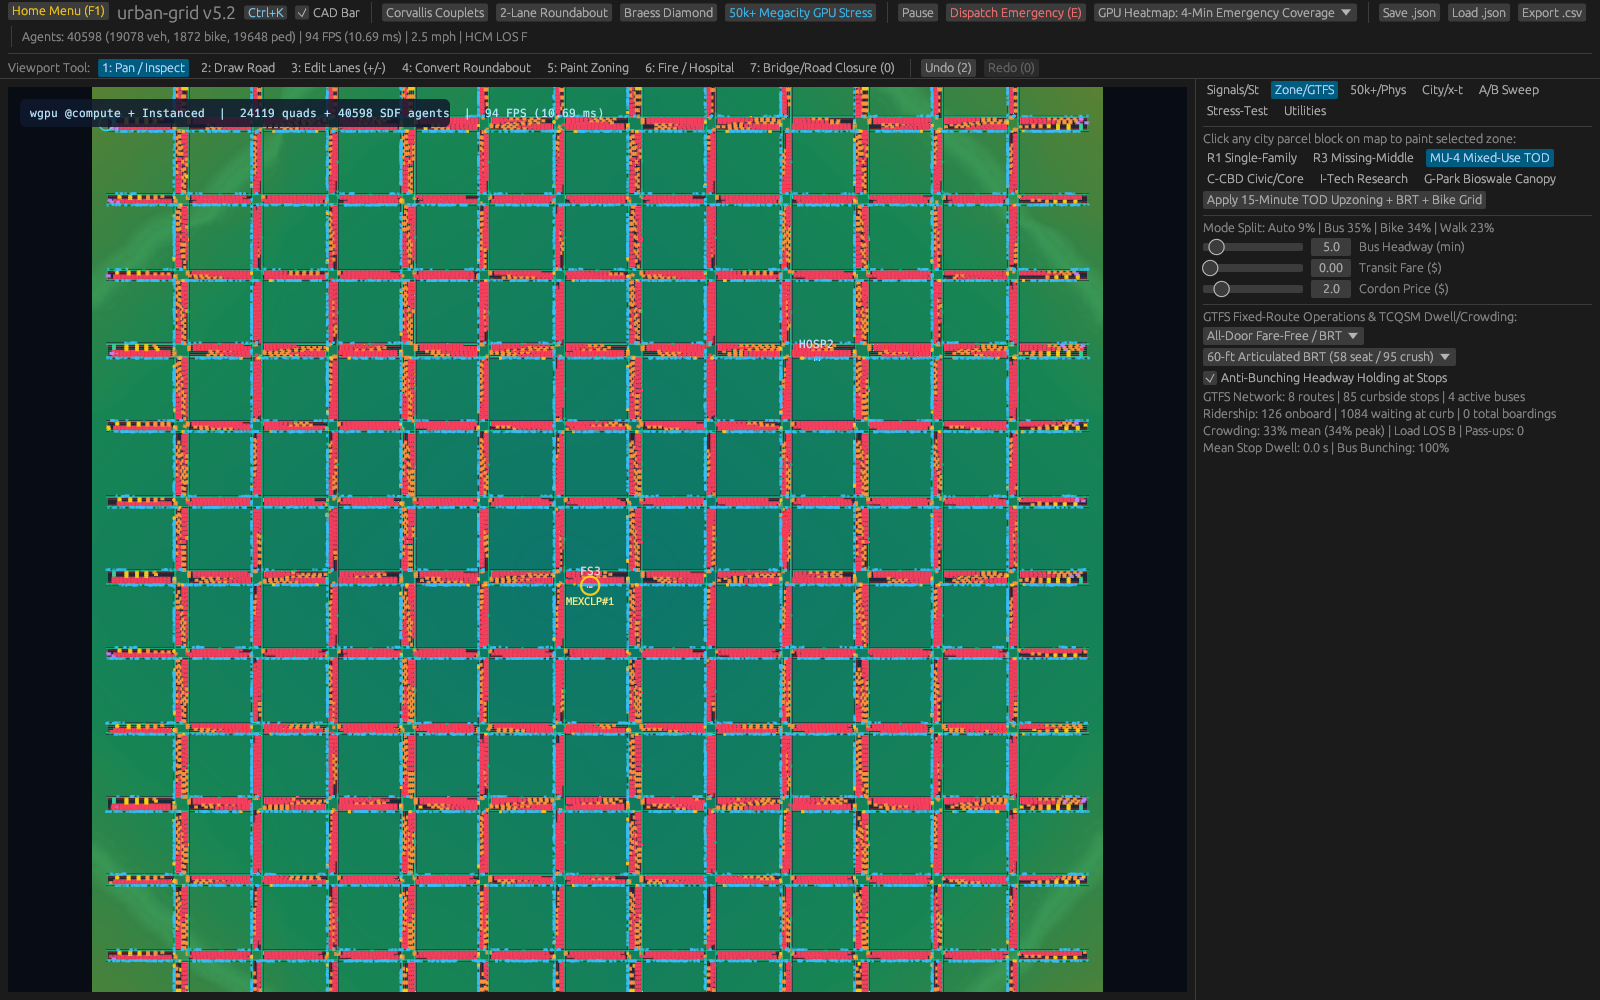
Civil Engineering Classrooms and Transportation Modeling Studios
Civil engineering faculty and urban design instructors equally gain an engaging offline capstone laboratory combining microscopic IDM car-following differential equations[1], signal control, stochastic emergency queueing, and inter-dependent utility restoration graphs directly onto familiar hometown streets.
Neighborhood Safety Workshops and First-Responder Coordination
Beyond engineering universities, fire chiefs, school transportation coordinators, and neighborhood safety associations share a practical concern: knowing whether a single flooded arterial road, stalled freight train, or bridge construction closure will trap rush-hour commuters or isolate an assisted-living complex miles from the nearest ladder company. Traditional traffic-engineering packages require specialized licensing and weeks of external consulting setup before local residents ever see a readable map. By turning open street networks directly into interactive offline street-by-street simulations, Urban-Grid lets local emergency responders rehearse hurricane lane reversals, adjust traffic-light timing around stadium exits, and observe concretely how dispatching ambulances from neighboring stations changes arrival times across every city block.
Making Lifeline Dependencies Visible Before Disasters Strike
Ordinary taxpayers rarely realize how tightly urban infrastructure networks lean on one another until a severe storm strikes: a single flooded electrical substation can silently stall clean-water pumping stations, traffic signals, and hospital backup fuel logistics across adjacent neighborhoods hours after wind speeds drop. Modeling power, potable water, telecom, and roadway repairs simultaneously on one tabletop dashboard helps city councils prioritize seismic retrofits and backup generators based on how many downstream households recover faster rather than guesswork. Distributed alongside public ecological and environmental tools at crvscience.com/apps, Urban-Grid brings transparent disaster-resilience analysis directly within reach of small towns and civic workshops alike.
Public Transit Clarity and Open Civic Accountability
Public transit advocates, disability-access coalitions, and neighborhood open-data journalists also look closely at emergency response equity whenever municipalities relocate a fire station or rezone dense apartment corridors near floodplains. Too often, public hearings turn into technical standoff moments because residents cannot inspect the underlying travel-time coverage math themselves. Opening Urban-Grid interactively lets civic participants see exactly why siting two complementary stations cuts worst-case travel gaps across industrial zones, waterfront neighborhoods, and steep hillside streets far better than clustering vehicles along a single wealthy boulevard. Turning evacuation timing, utility crew repair schedules, and congestion waves into plain tabletop visuals empowers ordinary taxpayers, municipal clerks, and student urbanists to evaluate civic infrastructure investments calmly using inspectable open street geometry and repeatable numerical records. Sharing consistent planning assumptions openly alongside clear visual timelines also helps neighborhoods situated near floodplains, highway bottlenecks, or aging river crossings raise practical safety questions early in budgeting discussions rather than discovering emergency access gaps only after major storms disrupt regional corridors.
5. Open Access & Connections Across the CRV Science App Network
Open Access and Connections Across the CRV Science App Network
All Urban-Grid OpenStreetMap connectors, IDM/MOBIL traffic rules, hypercube emergency queueing models, seismic fragility tables, and 3D GPU renderers reside publicly inside the CRV Science Apps Hub at https://crvscience.com/apps for public civic analysis and university coursework.
Within the twelve-application CRV Science suite[4–20], Urban-Grid links civil infrastructure readiness directly with climate hazards, epidemiology, and continuous mathematics: EpiLedger protects regional infectious-disease and hospital surge monitoring during emergencies without sacrificing patient confidentiality; TerraTwin provides long-term 21st-century coastal storm-surge and heat-stress trajectories testing waterfront corridors; AeroFlyway illuminates downtown light corridors intersecting nocturnal songbird migration; and Calc-Lab provides accessible visual intuition for the ordinary differential equations steering smooth vehicle acceleration.
References
- [1] Treiber, M., Hennecke, A., & Helbing, D. (2000). Congested traffic states in empirical observations and microscopic simulations. Physical Review E. https://doi.org/10.1103/physreve.62.1805
- [2] Daskin, M. S. (1983). A Maximum Expected Covering Location Model: Formulation, Properties and Heuristic Solution. Transportation Science. https://doi.org/10.1287/trsc.17.1.48
- [3] Bruneau, M., et al. (2003). A Framework to Quantitatively Assess and Enhance the Seismic Resilience of Communities. Earthquake Spectra. https://doi.org/10.1193/1.1623497
- [4] White, B. P. (2026). The CRV Science App Network: Seventeen Open-Source Rust Programs for Science, Data, and Simulation. CRV Science App Preprint APP-PREPRINT-01 [cs.SE, cs.CE, q-bio.QM], v1.0.0. Hosted via CRV Science Apps Hub (https://crvscience.com/apps). https://doi.org/10.5281/zenodo.24222398
- [5] White, B. P. (2026). AeroFlyway: Tracking Bird Migration with Weather Radar, Skyglow Maps, and Nighttime Flight Calls. CRV Science App Preprint APP-PREPRINT-13 [q-bio.PE, physics.ao-ph, cs.GR], v0.6.0. Hosted via CRV Science Apps Hub (https://crvscience.com/apps). https://doi.org/10.5281/zenodo.24222366
- [6] White, B. P. (2026). BeoFold: Simulating How Proteins Fold Using Distributed Computing and State Networks. CRV Science App Preprint APP-PREPRINT-02 [q-bio.BM, physics.chem-ph, cs.DC], v1.4.0. Hosted via CRV Science Apps Hub (https://crvscience.com/apps). https://doi.org/10.5281/zenodo.24222370
- [7] White, B. P. (2026). Calc-Lab: Interactive Calculus, Linear Algebra, and Differential Equation Solver Workbench. CRV Science App Preprint APP-PREPRINT-03 [math.NA, cs.MS, cs.CY], v0.5.0. Hosted via CRV Science Apps Hub (https://crvscience.com/apps). https://doi.org/10.5281/zenodo.24222372
- [8] White, B. P. (2026). Causal-Atlas: Tracing How Genes and Drugs Turn Biological Pathways On and Off. CRV Science App Preprint APP-PREPRINT-04 [q-bio.MN, q-bio.GN, stat.ML], v0.2.0. Hosted via CRV Science Apps Hub (https://crvscience.com/apps). https://doi.org/10.5281/zenodo.24222376
- [9] White, B. P. (2026). Cit-Atlas: Mapping Citation Networks and Research Impact Across Scientific Papers. CRV Science App Preprint APP-PREPRINT-05 [cs.DL, cs.SI, physics.soc-ph], v1.8.0. Hosted via CRV Science Apps Hub (https://crvscience.com/apps). https://doi.org/10.5281/zenodo.24222380
- [10] White, B. P. (2026). EpiLedger: Privacy-Safe Disease Tracking, Clinical Text Screening, and Outbreak Monitoring. CRV Science App Preprint APP-PREPRINT-06 [cs.CR, q-bio.PE, stat.AP], v2.0.0. Hosted via CRV Science Apps Hub (https://crvscience.com/apps). https://doi.org/10.5281/zenodo.24222382
- [11] White, B. P. (2026). ITME: Simulating Four Billion Years of Life, Oceans, and Atmosphere Evolution. CRV Science App Preprint APP-PREPRINT-07 [q-bio.PE, nlin.AO, physics.bio-ph], v2.3.0. Hosted via CRV Science Apps Hub (https://crvscience.com/apps). https://doi.org/10.5281/zenodo.24222386
- [12] White, B. P. (2026). OSABT: All-in-One Toolkit for Plant Physiology, Survival Curves, Genetics, and Enzyme Kinetics. CRV Science App Preprint APP-PREPRINT-08 [q-bio.QM, stat.AP, cs.SE], v2.0.0. Hosted via CRV Science Apps Hub (https://crvscience.com/apps). https://doi.org/10.5281/zenodo.24222388
- [13] White, B. P. (2026). SAR-Atlas: Drug Design, Body Distribution Modeling, and Candidate Screening in Rust. CRV Science App Preprint APP-PREPRINT-09 [physics.chem-ph, q-bio.BM, cs.LG], v3.8.0. Hosted via CRV Science Apps Hub (https://crvscience.com/apps). https://doi.org/10.5281/zenodo.24222390
- [14] White, B. P. (2026). TerraTwin: Fast Climate Projections for Global Warming, Sea-Level Rise, and Arctic Change. CRV Science App Preprint APP-PREPRINT-10 [physics.ao-ph, cs.CE, stat.AP], v2.5.0. Hosted via CRV Science Apps Hub (https://crvscience.com/apps). https://doi.org/10.5281/zenodo.24222392
- [15] White, B. P. (2026). WildFront BattleGrounds: Turn-Based Hex Strategy Game with Voxel Graphics and Procedural Map Generation. CRV Science App Preprint APP-PREPRINT-12 [cs.GT, cs.GR, math.CO], v3.4.1. Hosted via CRV Science Apps Hub (https://crvscience.com/apps). https://doi.org/10.5281/zenodo.24222396
- [16] White, B. P. (2026). HelioProbe: Simulating Spacecraft Orbits, Deep-Space Telescopes, and Comet Tails in 3D. CRV Science App Preprint APP-PREPRINT-14 [astro-ph.EP, astro-ph.IM, cs.GR], v2.3.0. Hosted via CRV Science Apps Hub (https://crvscience.com/apps). https://doi.org/10.5281/zenodo.24244083
- [17] White, B. P. (2026). PopBio-Studio: Interactive Population Biology, Adaptive Landscapes, and Genetic Skyline Simulator. CRV Science App Preprint APP-PREPRINT-15 [q-bio.PE, q-bio.QM, stat.AP], v1.2.0. Hosted via CRV Science Apps Hub (https://crvscience.com/apps). https://doi.org/10.5281/zenodo.24244085
- [18] White, B. P. (2026). QuantaCrypt-Studio: Simulating Quantum Circuits, Quantum Key Distribution, and Post-Quantum Cryptography. CRV Science App Preprint APP-PREPRINT-16 [quant-ph, cs.CR, cs.MS], v2.2.0. Hosted via CRV Science Apps Hub (https://crvscience.com/apps). https://doi.org/10.5281/zenodo.24244089
- [19] White, B. P. (2026). SonoWing: Analyzing Bat Echolocation and Bird Calls with Spectrograms and Harmonic Tracking. CRV Science App Preprint APP-PREPRINT-17 [q-bio.NC, q-bio.PE, cs.SD], v1.1.0. Hosted via CRV Science Apps Hub (https://crvscience.com/apps). https://doi.org/10.5281/zenodo.24244091
- [20] White, B. P. (2026). SwarmForge: 3D Isometric Automated Factory and Swarm Robotics Simulation Game. CRV Science App Preprint APP-PREPRINT-18 [cs.MA, cs.RO, cs.GT], v1.3.0. Hosted via CRV Science Apps Hub (https://crvscience.com/apps). https://doi.org/10.5281/zenodo.24244093