Introduction: The Changing Sky and the Radiative Paradigm
High-Level Overview of the Shortwave Transformation
Contemporary climate science has traditionally centered its analytical and policy frameworks on the thermal infrared trapping of anthropogenic greenhouse gases[1]. Over the first quarter of the twenty-first century, however, spaceborne radiometric observations have revealed a concurrent transformation in the shortwave sector of the planetary radiation budget[2]. As synthesized by climate science writer Dr. Tom Harris in his Climate Uncovered treatise, Poetic, Evocative, Dangerous: The Dark Side of Earth's Changing Clouds, and his companion analyses on planetary darkening, global cloud cover is contracting[4]. Rather than representing a temporary perturbation caused solely by declining industrial particulate pollution, accumulating empirical and paleoclimatic evidence indicates that this contraction is increasingly governed by a warming-driven thermodynamic feedback loop[4]. By exposing darker underlying ocean and land surfaces to direct solar insolation, retreating low-level cloud decks accelerate energy accumulation within the climate system, pushing effective climate sensitivity toward the upper bounds of conventional model projections and offering a physical resolution to long-standing discrepancies in the geological record[4].
Specific Scientific Details of Cloud Radiative Mechanics
Evaluating the magnitude of this shift requires an examination of the dual radiative role that clouds play within the terrestrial energy budget[11]. At the top of the atmosphere, the planet receives an average solar irradiance derived from a solar constant recommended by the International Astronomical Union at 1,361 watts per square meter, with spectral integrations by Gueymard yielding 1,361.1 watts per square meter with a standard uncertainty of 0.5 watts per square meter, and International Space Station solar spectrometer measurements yielding 1,372.3 watts per square meter at one standard deviation[11]. When distributed across the spherical geometry of the globe by dividing by four, the accepted solar constant equates to a mean incoming top-of-atmosphere solar flux of approximately 340.25 watts per square meter[11]. Clouds cover roughly two-thirds of the planetary surface at any given moment and reflect more than 20 percent of this incoming shortwave solar radiation directly back into space[5].
According to satellite measurements from the Clouds and the Earth's Radiant Energy System (CERES) Energy Balanced and Filled (EBAF) Edition 4.0 dataset, if all clouds were removed from the atmosphere, Earth's clear-sky reflected shortwave flux would average only 53.3 watts per square meter, corresponding to a baseline surface and aerosol albedo of 0.154[11]. The presence of cloud cover elevates the annual mean all-sky reflected shortwave flux to 99.1 watts per square meter, establishing an observed global planetary albedo of 0.291[11]. Cloud cover therefore nearly doubles the reflectivity of the planet, providing a shortwave reflective cooling effect of approximately 45.8 watts per square meter[11].
Simultaneously, clouds exert an opposing greenhouse influence on outgoing longwave thermal radiation[11]. In a cloud-free atmosphere, top-of-atmosphere outgoing longwave radiation would average 268.1 watts per square meter[11]. Under observed all-sky conditions, clouds absorb ascending thermal infrared radiation emitted by the warm surface and re-emit it from colder cloud tops at higher altitudes, reducing the annual mean all-sky outgoing longwave flux to 240.1 watts per square meter[11]. By blocking 27.9 watts per square meter of outgoing thermal energy, clouds warm the climate system[11]. Because the shortwave reflective cooling of roughly 45.8 watts per square meter exceeds the longwave thermal trapping of 27.9 watts per square meter, the global net radiative effect of clouds in the modern climate state is a substantial net cooling[11]. Consequently, even minor fractional reductions in global cloud coverage or optical thickness disproportionately increase the net absorption of solar energy at the surface[5].
This radiative asymmetry has prompted scientific debate within meteorological circles regarding the primary causal driver of modern warming[1]. In documented discussions between Tom Harris and Simon Bevan of the Royal Meteorological Society, analysts questioning carbon-centered attribution have pointed out that recent growth in Earth's Energy Imbalance is numerically dominated by an additional 1 to 2 watts per square meter of absorbed shortwave solar radiation stemming from declining cloud cover, rather than by a direct reduction in top-of-atmosphere outgoing longwave radiation[1]. Based on the observation that shortwave changes dominate the net radiative gain and that the tropical upper-tropospheric warming hotspot appears muted in certain datasets, some commentators have argued that natural cloud variability and albedo shifts outweigh carbon dioxide as the primary driver of the observed 1.5 degrees Celsius warming[1].
Harris and mainstream radiative transfer analyses resolve this apparent contradiction by distinguishing between initial radiative forcings and secondary thermodynamic feedbacks[1]. In an unperturbed, radiatively balanced planetary system, an isolated increase in shortwave solar absorption warms the surface and troposphere, which in turn increases outgoing longwave thermal emission according to fundamental blackbody thermodynamics until radiative equilibrium is restored[1]. Satellite clear-sky observations confirm, however, that outgoing longwave radiation is not escaping freely at the spectral bands absorbed by greenhouse gases; rather, thermal energy is being blocked and retained within the lower atmosphere, preventing nighttime clear-sky temperatures from dropping as low as they did five decades ago[1]. Furthermore, outgoing longwave radiation from cloudy regions has increased because the remaining clouds themselves are warming despite the reduction in total cloud area, partially masking the longwave trapping signature at the top of the atmosphere[1]. Meanwhile, the warming atmosphere holds substantially more water vapor—an increase documented at roughly 75 percent in specific atmospheric moisture metrics relative to 1991 to 2002 baselines—which acts as a potent amplifying greenhouse gas while fewer clouds let in more shortwave energy[13]. Carbon dioxide and land-use changes thus operate as the planetary thermostat that initiates the warming, whereas the subsequent contraction of reflective cloud cover and expansion of atmospheric water vapor operate as coupled positive feedbacks that amplify the thermal response[1].
Satellite Telemetry and the Acceleration of Earth's Energy Imbalance
High-Level Overview of Radiative Imbalance Trends
Over the past two decades, spaceborne radiometers and autonomous ocean profiling floats have tracked a continuous, statistically significant divergence between the radiant energy entering Earth's atmosphere and the thermal energy exiting back to space[2]. This net radiative surplus—termed Earth's Energy Imbalance (EEI)—has more than doubled during the twenty-first century, driving sustained ocean heat accumulation and culminating in a pronounced global surface temperature increase between 2023 and 2025[14]. Detailed attribution of satellite and reanalysis datasets demonstrates that the primary energetic catalyst for this recent thermal anomaly was a record-low planetary albedo, precipitated by a marked contraction of low-level marine cloud decks across the northern mid-latitudes and the tropics[14].
Specific Scientific Details of the CERES and ERA5 Records
The empirical foundation for tracking planetary darkening rests on the CERES instrument suite aboard the Terra, Aqua, and subsequent satellite platforms, which measure broadband radiative fluxes across three channels: shortwave solar radiation spanning 0.3 to 5 micrometers, thermal window radiation spanning 8 to 12 micrometers, and total radiation spanning 0.3 to greater than 100 micrometers[11]. Although NASA canceled the planned CERES follow-on Radiation Budget Instrument (RBI) on the JPSS-2 platform in January 2018 due to cost overruns, ongoing missions such as the Total and Spectral Solar Irradiance Sensor (TSIS) aboard the International Space Station and existing CERES EBAF products continue to maintain the climate data record[11]. Converting raw directional satellite radiance measurements into hemispherical radiative fluxes (irradiance) requires complex angular distribution models derived from the Earth Radiation Budget Experiment (ERBE) and CERES SYN1deg products that account for reflected shortwave anisotropy across varying solar zenith angles, viewing zenith angles, relative azimuth angles, and twelve distinct scene types combining fixed surface properties with time-varying cloud fractions[22]. By combining two complementary satellite orbits, annual root-mean-square errors in total outgoing radiation are constrained to less than or equal to 0.10 watts per square meter, anchored to in-situ ocean heat uptake measurements[17]. While oceanic waters absorb roughly 90 percent of excess planetary heat, the atmosphere itself contributes only 1 to 2 percent to the long-term mean of Earth's Energy Imbalance, acting instead as the dynamic radiative regulator governing the imbalance[17].
Between 2001 and 2020, linear regression fits of deseasonalized CERES observations yielded a statistically significant positive trend in Earth's Energy Imbalance of +0.38 plus or minus 0.24 watts per square meter per decade at the 95 percent confidence level[2]. Over the same twenty-year window, outgoing longwave radiation exhibited a positive trend of +0.28 plus or minus 0.22 watts per square meter per decade—indicating that a warming Earth was radiating more thermal heat toward space due to a near-offset between positive temperature and water-vapor feedbacks and negative greenhouse gas forcing components—while reflected shortwave radiation declined markedly[2]. Earlier sub-period comparisons by Loeb and colleagues also identified a reduction of 0.83 plus or minus 0.41 watts per square meter in global reflected shortwave top-of-atmosphere flux during 2000 to 2017 compared to the 2000 to 2014 warming hiatus reference period, driven directly by reductions in low-cloud cover[11]. To test whether this multi-decadal energy accumulation could be an artifact of unforced internal climate oscillations, researchers compared the CERES record against large ensembles of Coupled Model Intercomparison Project Phase 6 (CMIP6) control runs, CMIP6 historical ensembles, and Geophysical Fluid Dynamics Laboratory Atmosphere Model 4 (AM4) simulations forced with prescribed sea surface temperatures and sea ice[2]. Although internal variability dominates shortwave trend uncertainty over twenty-year windows more than longwave uncertainty, the modeling experiments demonstrated that the probability of internal variability and observational uncertainty coinciding to generate the observed two-decade EEI trend is less than 1 percent; rather, anthropogenic radiative forcing and associated cloud and surface feedbacks are required to explain the trend[2].
In recent years, the rate of planetary heat accumulation has accelerated substantially, with Watanabe and colleagues confirming in 2025 that Earth's Energy Imbalance has more than doubled over recent decades[17]. While the Intergovernmental Panel on Climate Change (IPCC) Sixth Assessment Report (AR6) assessed the likely range of EEI for the 2006 to 2018 period at 0.52 to 1.06 watts per square meter, with a central midpoint estimate of 0.775 watts per square meter and a diagnostic standard deviation of 0.16 watts per square meter under a strict 90 percent normal distribution interpretation (or 0.24 watts per square meter as a conservative sensitivity case)[8], the decadal trend in EEI measured by CERES during the decade prior to 2023 (2013 to 2022) rose to +0.76 watts per square meter per decade[14].
This radiative acceleration culminated in the global temperature anomalies of 2023 and 2024[14]. Following the 2015 to 2016 El Niño event, global mean warming had been temporarily offset by persistent La Niña conditions[14]. Beginning in March 2023—well ahead of substantial thermal contributions from the moderate 2023 to 2024 El Niño event—global sea surface temperatures broke historical records[14]. For the full calendar year of 2023, global mean surface temperature reached 1.48 kelvin (nearly 1.5 kelvin) above the pre-industrial baseline, surpassing the previous warmest year on record by 0.17 kelvin[14]. When climate physicists aggregated the expected warming contributions from anthropogenic greenhouse gas accumulation and the onset of El Niño, their best-estimate reconstructions fell short by approximately 0.2 kelvin (0.2 degrees Celsius)[21].
In a 2025 study published in Science, Helge Goessling, Thomas Rackow, and Thomas Jung investigated this 0.2 kelvin discrepancy by analyzing combined CERES top-of-atmosphere radiation budgets and European Centre for Medium-Range Weather Forecasts Reanalysis v5 (ERA5) vertical profiles[14]. Their analysis revealed that the 2023 temperature increase coincided with a record-high Earth Energy Imbalance anomaly of +0.97 watts per square meter in CERES and +0.31 watts per square meter in ERA5 relative to the 2001 to 2022 average[14]. This energy peak was not caused by a decrease in outgoing longwave radiation; instead, outgoing longwave radiation increased as the planet heated, largely offsetting an even larger rise in absorbed solar radiation (ASR)[14]. Specifically, absorbed solar radiation followed a 2013 to 2022 decadal upward trend of +1.10 watts per square meter per decade in CERES and +0.97 watts per square meter per decade in ERA5 before reaching positive anomalies in 2023 of +1.82 watts per square meter in CERES and +1.31 watts per square meter in ERA5[14].
| Radiative or Climatic Metric | Observational or Model Source | Reference Period or Condition | Quantitative Value | Physical Interpretation and Context |
|---|---|---|---|---|
| Solar Constant (TSI) | IAU Standard and Gueymard (2018) | Mean Earth-Sun Distance | 1,361.0 to 1,361.1 watts per square meter | Yields 340.25 watts per square meter mean global top-of-atmosphere insolation[11] |
| Clear-Sky Reflected Shortwave | CERES EBAF Ed4.0 | Annual Mean Baseline | 53.3 watts per square meter (Albedo: 0.154) | Reflectivity of Earth's surface and aerosols without clouds[11] |
| All-Sky Reflected Shortwave | CERES EBAF Ed4.0 | Annual Mean Baseline | 99.1 watts per square meter (Albedo: 0.291) | Clouds nearly double planetary albedo (+45.8 watts per square meter reflection)[11] |
| Clear-Sky Outgoing Longwave | CERES EBAF Ed4.0 | Annual Mean Baseline | 268.1 watts per square meter | Thermal infrared flux escaping in the absence of cloud cover[11] |
| All-Sky Outgoing Longwave | CERES EBAF Ed4.0 | Annual Mean Baseline | 240.1 watts per square meter | Clouds trap 27.9 watts per square meter of outgoing longwave thermal flux[11] |
| Long-Term EEI Trend | CERES Satellite Record | 2001 to 2020 Linear Fit | +0.38 plus or minus 0.24 watts per square meter per decade | Less than 1 percent probability of arising from internal variability[2] |
| Long-Term OLR Trend | CERES Satellite Record | 2001 to 2020 Linear Fit | +0.28 plus or minus 0.22 watts per square meter per decade | Near offset between positive feedback and negative forcing[2] |
| Assessed Mean EEI | IPCC AR6 WGI (Table 7.1) | 2006 to 2018 Likely Range | 0.52 to 1.06 watts per square meter (Mean: 0.775) | Diagnostic standard deviation estimated at 0.16 watts per square meter[8] |
| Recent Decadal EEI Trend | CERES and Goessling et al. (2025) | 2013 to 2022 Trend | +0.76 watts per square meter per decade | Reflects rapid acceleration of planetary heat uptake[14] |
| 2023 EEI Peak Anomaly | CERES and ERA5 Reanalysis | 2023 vs. 2001 to 2022 Baseline | +0.97 (CERES) and +0.31 (ERA5) watts per square meter | Half of CERES-ERA5 gap explained by solar cycle peak[14] |
| Recent Decadal ASR Trend | CERES and ERA5 Reanalysis | 2013 to 2022 Trend | +1.10 (CERES) and +0.97 (ERA5) watts per square meter per decade | Sustained multi-annual increase in absorbed shortwave energy[14] |
| 2023 ASR Peak Anomaly | CERES and ERA5 Reanalysis | 2023 vs. 2001 to 2022 Baseline | +1.82 (CERES) and +1.31 (ERA5) watts per square meter | Driven predominantly by record-low planetary albedo[14] |
| 2023 Solar Incident Anomaly | CERES and ERA5 Reanalysis | 2023 vs. 2001 to 2022 Baseline | +0.28 (CERES) and -0.08 (ERA5) watts per square meter | Explains 0.20 watts per square meter of CERES ASR and +0.027 kelvin warming[14] |
| Cumulative Albedo Decline | CERES and Multi-Study Synthesis | 2000 to 2020 and 2023 | -0.5 to -0.8 percent (Lowest since 1940) | Adds 1.7 to 2.0 watts per square meter absorbed shortwave flux; new low in 2025[8] |
| Low-Cloud Cover (LCC) Decline | ERA5 and Goessling et al. (2025) | 2013 to 2022 Trend and 2023 Anomaly | -1.27 percent per decade; -1.5 percent in 2023 | Represents a -4.0 percent relative loss from the 38 percent global LCC mean[14] |
Goessling and colleagues systematically decomposed the contributors to this shortwave absorption anomaly[14]. Variations in incident solar radiation (ISR) over the 11-year solar cycle are generally an order of magnitude smaller than the observed absorption increase[14]. During 2023, however, a strong solar-cycle maximum produced a positive incident solar radiation anomaly in CERES of +0.28 watts per square meter, whereas ERA5 forcing assumed a negative anomaly of -0.08 watts per square meter[14]. Given Earth's baseline planetary albedo of roughly 29 percent, this solar irradiance peak accounted for approximately 0.20 watts per square meter of the 2023 absorbed solar radiation anomaly in CERES—explaining nearly half of the discrepancy between the CERES and ERA5 energy budgets—and contributed 0.027 plus or minus 0.005 kelvin (roughly 0.03 kelvin) to the 2023 global temperature anomaly, while ERA5 solar forcing yielded -0.016 plus or minus 0.003 kelvin and El Niño added roughly 0.07 kelvin[14]. In a counterfactual diagnostic removing the albedo decline, the total Earth Energy Imbalance anomaly would have dropped below -1 watt per square meter toward the end of 2023[14].
The predominant share of the shortwave energy increase—accounting for the unexplained 0.2 degrees Celsius of warming—stemmed from a decline in planetary albedo to its lowest level since at least 1940, a trend that continued into March 2025 as the 36-month running average of planetary albedo reached new record lows in the CERES EBAF Edition 4.2.1 record[14]. While polar regions experienced notable surface albedo declines due to sea-ice and snow retreat, such as an austral summer 2022 to 2023 surface albedo anomaly of -0.4 percent that briefly equaled the global planetary albedo anomaly, surface reflectivity changes are attenuated by a factor of roughly three on average at the top of the atmosphere because cloud cover masks the underlying surface, an attenuation that is even stronger in cloudy polar regions[14]. Outside the polar zones, clear-sky shortwave anomalies were an order of magnitude smaller than all-sky anomalies, confirming that changing cloud properties—where the 2023 global-mean total cloud radiative effect anomaly of +1.21 watts per square meter in ERA5 closely matched the +1.33 watts per square meter absorbed solar anomaly—dominated the darkening of the planet[14].
Because CERES broadband radiometers measure total column radiation, Goessling's team utilized ERA5 vertical reanalysis profiles to partition cloud trends by altitude[28]. The vertical decomposition revealed that high-level clouds remained stable, whereas low-level cloud cover contracted substantially[28]. Globally averaged, low-level cloud cover declined at a rate of -1.27 percent per decade between 2013 and 2022, and registered a single-year anomaly of -1.5 percent in 2023[14]. Measured against the absolute global-mean low-cloud coverage baseline of approximately 38 percent, the 2023 deficit represented a relative loss of 4.0 percent of the planet's low-altitude cloud deck[14].
Spatially, these low-cloud reductions were concentrated across the northern mid-latitudes and the tropics, where regional absorbed solar radiation anomalies locally reached 10 watts per square meter over the eastern Indian Ocean, South America, and the eastern Pacific within the northern branch of the Intertropical Convergence Zone[20]. Coherent multi-year (2013 to 2022) and 2023 low-cloud losses occurred over the Indo-Pacific warm pool around the Maritime Continent, the northern extratropical western Pacific, and almost the entire Atlantic basin and adjacent land regions—most acutely in the eastern North Atlantic, which served as a primary driver of the 2023 global surface temperature increase[14]. Over continental land surfaces, cloud cover reductions have also been prominent, reducing atmospheric attenuation and increasing the relative importance of land-surface albedo changes in the future[25]. Complementing these regional boundary-layer losses, macroscopic satellite analyses by Tselioudis and colleagues in 2025 demonstrated that a systematic contraction of mid-latitude and tropical storm zones has further expanded clear-sky radiation windows, reinforcing the global increase in solar absorption[25].
Disentangling Aerosol Unmasking from Thermodynamic Cloud Feedbacks
High-Level Overview of Causal Attribution
A central analytical focus of Tom Harris's Dimming Down and Poetic, Evocative, Dangerous essays—and a key question in contemporary atmospheric physics—is the causal attribution of this low-cloud contraction[4]. Specifically, researchers seek to disentangle how much of the post-2000 albedo decline represents a temporary aerosol unmasking effect triggered by air-quality regulations and cleaner maritime shipping fuels, versus how much represents an endogenous, warming-driven low-cloud feedback that will continue to amplify warming throughout the twenty-first century[4]. While declining sulfate aerosols have contributed to regional shortwave brightening over industrial corridors and shipping lanes, microphysical buffering mechanisms and global energy-budget diagnostics indicate that aerosol reductions alone cannot account for the magnitude of the observed darkening; rather, a positive cloud feedback is actively emerging[8].
Specific Scientific Details of Microphysical Buffering and Feedbacks
Anthropogenic aerosols—principally sulfate particulates derived from industrial coal combustion and high-sulfur bunker fuels used in international shipping—exert a cooling influence on the global climate that partially offsets greenhouse gas warming[15]. Because tropospheric aerosols have a short atmospheric residence time of only up to several days, their radiative forcing responds rapidly to emission reductions[17]. In the IPCC Sixth Assessment Report, total anthropogenic aerosol effective radiative forcing (ERFari+aci) is assessed at -1.3 watts per square meter, with a very likely range of -2.0 to -0.6 watts per square meter; over the 1750 to 2019 historical period, the headline aerosol effective radiative forcing is assessed at a somewhat smaller magnitude of -1.1 watts per square meter, with a likely range of -1.7 to -0.4 watts per square meter[29]. This total cooling effect is partitioned into two distinct physical pathways: aerosol-radiation interactions (ERFari), where airborne particulates directly scatter and absorb sunlight, assessed at -0.3 watts per square meter (very likely range of -0.6 to 0.0 watts per square meter); and aerosol-cloud interactions (ERFaci), where hydrophilic particulates serve as cloud condensation nuclei, assessed at -1.0 watts per square meter (very likely range of -1.7 to -0.3 watts per square meter)[28].
When air-quality regulations in North America, Europe, and East Asia—alongside the International Maritime Organization (IMO) 2020 regulations reducing sulfur content in shipping fuels—curtailed particulate emissions, the resulting decline in aerosol optical depth contributed to a clearing-sky phase that increased Earth's Energy Imbalance[17]. In 2023, CERES clear-sky absorbed solar radiation anomalies showed positive peaks between the equator and 45 degrees North over the Atlantic and Pacific Oceans, particularly off the East Asian Pacific coast and the African Atlantic coast, consistent with regional aerosol reductions[21].
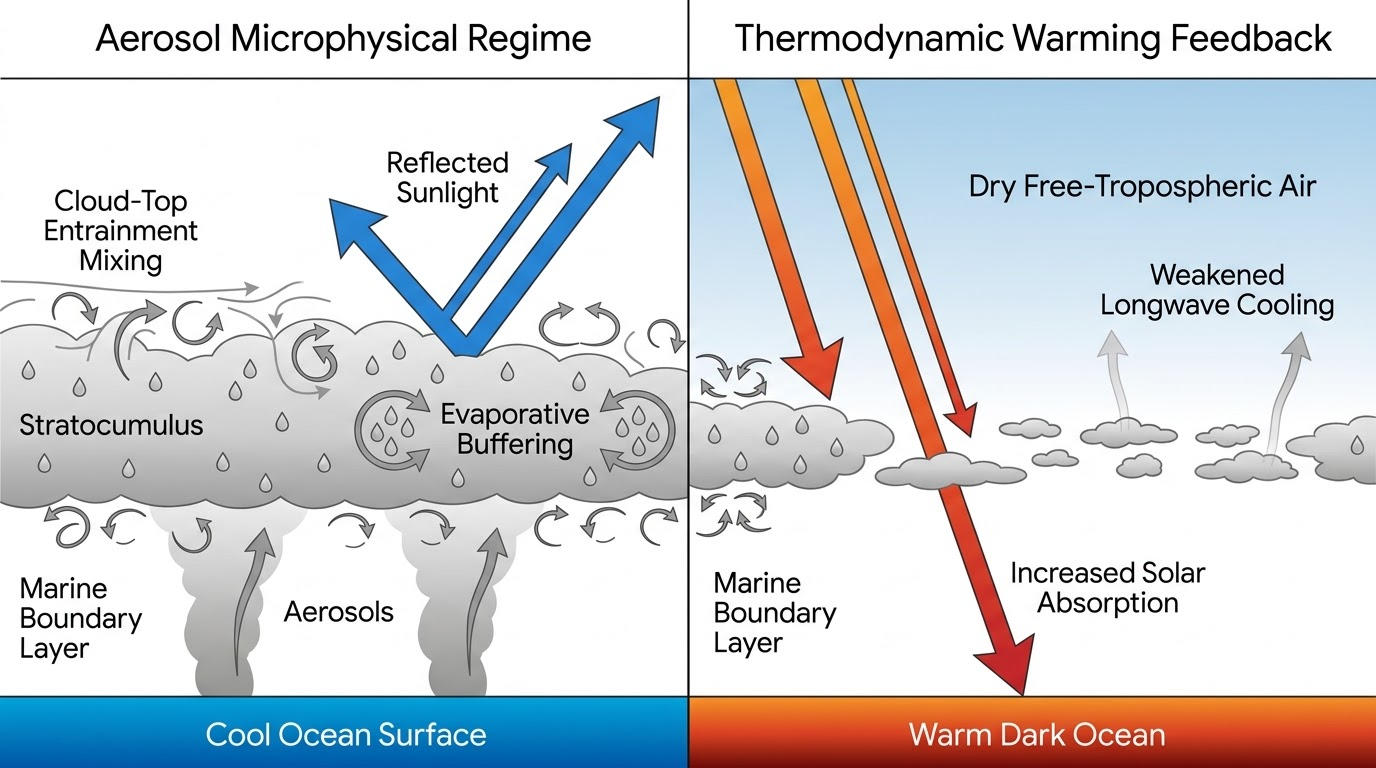
Detailed cloud-microphysical research demonstrates, however, that the response of low clouds to aerosol perturbations is highly nonlinear, regime-dependent, and subject to microphysical buffering mechanisms that dampen the net magnitude of aerosol-cloud interactions[29]. In stable atmospheric boundary layers dominated by liquid-phase stratiform low-level clouds, an influx of aerosols distributes available liquid water across a larger number of smaller droplets, suppressing droplet coalescence and precipitation and thereby increasing cloud liquid water content and duration—a mechanism known as the cloud lifetime effect[29]. Conversely, in unstable environmental regimes dominated by cumulus clouds over the tropics and subtropics, or within non-precipitating clouds, increasing aerosol concentrations can reduce cloud liquid water content[29]. Because smaller cloud droplets possess a higher surface-area-to-volume ratio, they evaporate much more rapidly than larger droplets when dry air from the free troposphere mixes into the cloud top[29]. This rapid evaporation intensifies cooling at the cloud boundary, driving stronger turbulent mixing and establishing an entrainment-evaporation feedback loop that thins the cloud[29]. While most General Circulation Models (GCMs) parameterize only the positive cloud-lifetime effect—causing them to simulate a uniform increase in liquid water from aerosols and, consequently, an exaggerated cloud loss from aerosol cleanup—high-resolution Large-Eddy Simulations (LES) and satellite observations confirm this bidirectional buffering[29].
Independent energy-budget diagnostic studies further constrain the role of aerosol unmasking relative to thermodynamic cloud feedbacks[8]. Research by Feinberg (2025, 2026) evaluated the magnitude of historical aerosol reverse forcing using two independent observational energy-balance diagnostic approaches—Earth Energy Imbalance analysis and an unsaturated linear Earth energy-budget framework—anchored to IPCC AR6 bounds[8]. Within the IPCC AR6 framework, the net climate feedback parameter is assessed within a physical range of -1.81 to -0.51 watts per square meter per kelvin[8]. Adopting an observationally constrained effective net feedback parameter of approximately -1.5 watts per square meter per kelvin (supported by empirical analyses of warming conditions by Dessler and colleagues and Gordon and colleagues)—alongside the observed historical warming of roughly 1.0 kelvin from the pre-industrial period to 2019 and the assessed EEI range of 0.52 to 1.06 watts per square meter—yields a total effective radiative forcing that is 30 to 40 percent smaller than the AR6 central estimate of approximately 3.3 watts per square meter[8]. This energetic constraint leaves limited residual scope for a large compensating negative aerosol forcing, constraining aerosol forcing well below the AR6 central estimates[8]. Consequently, the observed 0.5 to 0.8 percent reduction in planetary albedo between 2000 and 2020 documented by Helge Goessling, Thorsten Mauritsen, and colleagues—which added roughly 1.7 to 2.0 watts per square meter of absorbed shortwave radiation referenced to global-mean insolation—cannot be explained primarily as an externally imposed aerosol unmasking forcing[8]. Because the albedo decline scales coherently with temperature and cloud-state evolution, it is most consistently interpreted as an endogenous, feedback-driven response associated with cloud, sea-ice, and surface-albedo changes[8].
This conclusion aligns with advances in cloud feedback quantification between the fifth and sixth IPCC assessment cycles[30]. In IPCC AR6 Working Group I Chapter 7, the combined synthesis of satellite observations, explicit cloud simulations, and climate models decreased the uncertainty range of the cloud feedback by about 50 percent, assessing the net cloud feedback parameter at +0.42 watts per square meter per degree Celsius (with a likely range of -0.10 to +0.94 watts per square meter per degree Celsius) and establishing with high confidence that a net negative cloud feedback is very unlikely[29]. NASA Goddard Space Flight Center Science Task Group objectives continue to use observational constraints on low and high cloud feedbacks to reduce remaining uncertainties by an additional factor of two[33]. While the combined water-vapor and lapse-rate feedback makes the single largest contribution to global warming amplification, cloud feedback remains the largest source of overall uncertainty in climate sensitivity[30].
Observationally based decompositions, including analyses of International Satellite Cloud Climatology Project (ISCCP-H) data from 1987 to 2016 using relative variance contribution metrics across meteorological factors, demonstrate that low clouds exhibit nonlinear, timescale-dependent trends that cannot be fully captured by linear modeling frameworks[34]. Specifically, marine stratocumulus and cumulus clouds are primarily sensitive to surface temperature changes, whereas stratus clouds respond strongly to mid-level tropospheric humidity over oceans and surface sensible heat fluxes over land[34]. Over land, coupled cloud-surface feedbacks can also operate in complex ways; satellite observations from the Amazon indicate that cloud-mediated increases in top-of-atmosphere albedo associated with forest loss can approximately double the local cooling effect relative to surface brightening alone[25].
In the global CMIP6 model ensemble, the net positive cloud feedback increased by roughly 20 percent relative to CMIP5, driving up estimates of Equilibrium Climate Sensitivity (ECS—assessed by AR6 at a best estimate of 3.0 degrees Celsius, a likely range of 2.5 to 4.0 degrees Celsius, and a very likely range of 2.0 to 5.0 degrees Celsius, with virtual certainty that ECS exceeds 1.5 degrees Celsius)[30]. In several CMIP6 models, higher ECS and Transient Climate Response (TCR) values emerged from efforts to reduce biases in extratropical mixed-phase clouds compared to satellite observations; replacing over-predicted ice crystals with supercooled liquid droplets weakened the negative cloud-phase feedback, thereby unmasking stronger positive cloud feedbacks at mid-to-high latitudes (while Arctic and Antarctic sea-ice concentration reductions also drive distinct regional low-level cloud responses)[30].
Furthermore, IPCC AR6 emphasizes that radiative feedbacks are not static constants; rather, they vary across different timescales and climate states, giving rise to an effective feedback parameter that differs from the long-term equilibrium value[30]. Over multi-decadal timescales, as the spatial pattern of sea surface warming evolves, radiative feedbacks—particularly from clouds—are expected to become less negative and more strongly amplifying[30]. As noted in empirical analyses discussed on Tom Harris's Climate Uncovered, linear regressions of climate sensitivity across the instrumental record already reflect this upward trajectory: while a fit across the full modern historical record yields an apparent sensitivity of 2.37 kelvin per doubling of carbon dioxide, restricting the regression to the more recent warming record increases the slope to 2.92 kelvin per doubling[39]. Moreover, cross-model comparisons of the 20-year CERES shortwave trend against six highlighted CMIP6 Atmospheric Model Intercomparison Project (AMIP) runs and CERESMIP protocols demonstrate that while four of the six models produce statistically significant trends at the 95 percent confidence level, most underestimate the magnitude of the CERES trend (with the exception of CESM2), and models that match the global shortwave change often do so for the wrong physical reasons by misallocating clear-sky atmospheric, surface, and shortwave cloud radiative effect contributions[3].
Boundary-Layer Physics and the Stratocumulus Tipping Point
High-Level Overview of Subtropical Cloud Instability
Beyond the gradual weakening of low-cloud cover observed over the past two decades, boundary-layer physics indicates that marine low clouds harbor a distinct nonlinear instability[34]. Over the cool upwelling margins of the eastern subtropical oceans, expansive sheets of marine stratocumulus clouds act as the primary solar reflectors of the low latitudes[34]. Because these cloud decks are sustained by a delicate thermodynamic balance between cloud-top thermal cooling and dry-air entrainment across a sharp temperature inversion, sufficiently high greenhouse gas concentrations can overwhelm their self-sustaining turbulence, triggering an abrupt, hysteretic breakup into scattered cumulus clouds that adds approximately 8 degrees Celsius of global warming[40].
Specific Scientific Details of Large-Eddy Simulations
Stratocumulus clouds cover approximately 20 percent of the low-latitude oceans and have the highest coverage in the subtropical eastern ocean basins above cold upwelling zones, where they reflect between 30 and 60 percent of the shortwave solar radiation incident upon them back into space[34]. From a fluid-dynamics perspective, marine stratocumulus decks are unusual among Earth's cloud regimes[40]. Whereas typical convective clouds are driven from below by solar heating of the surface that creates buoyant thermals of warm air, the turbulence that sustains stratocumulus decks is driven from above by longwave radiative cooling of the cloud tops[40]. Specifically, liquid water droplets at the upper boundary of the stratocumulus deck emit thermal infrared radiation upward into the free troposphere[40]. This cloud-top radiative cooling chills the air parcels at the top of the cloud, propelling negatively buoyant air parcels downward toward the surface to sustain a well-mixed boundary layer that continuously draws moisture upward from the ocean surface[40].
High-resolution Large-Eddy Simulations (LES) of stratocumulus-to-cumulus transitions—both over marine subtropical domains and idealized continental boundary layers such as in southern West Africa—illuminate the micro-scale vertical processes governing cloud maintenance, thinning, and dissipation[40]. While regional studies by Adler and colleagues and Babić and colleagues note that cold air advection is necessary for initial cloud layer formation, idealized column experiments isolating boundary-layer dynamics show that the early-morning stratocumulus state forms a well-mixed, fully coupled layer extending from the surface to a cloud-top height of roughly 550 meters[43]. At around 05:00 UTC, this layer is capped by a narrow inversion layer (initially only about 50 meters thick between its lower and upper limits) across which liquid water potential temperature jumps by approximately 4 kelvin, separating the cool, moist boundary layer below from the warm, dry free troposphere above[43].
As daytime shortwave radiation penetrates the cloud deck, the cloud absorbs roughly 44 watts per square meter of shortwave flux along its path, locally warming the lower two-thirds of the cloud layer by roughly 1.1 kelvin per hour under a high cloud droplet concentration of 300 droplets per cubic centimeter[43]. Simultaneously, surface sensible and latent heat fluxes and wind shear at the cloud top accelerate turbulent mixing across the inversion interface, accelerating the breakup and transition by about two hours[43]. As warm, dry free-tropospheric air is entrained across the inversion and buoyant convective cumulus clouds become active above 950 meters, the inversion layer broadens from a 50-meter interface to a transition zone thicker than 1 kilometer in the afternoon, with remnant stratocumulus clouds persisting at altitudes of 1,200 to 1,300 meters[43]. After 10:00 UTC, because the stratocumulus cloud base rises faster than the cloud top, the stratiform layer progressively thins and eventually dissipates around 14:00 UTC, leaving behind scattered cumulus clouds[43].
Because the dynamical scales of these turbulent eddies and cloud-top radiative cooling processes (where liquid water spectra transition to a minus-one power law at scales smaller than 1 kilometer) are too small to be resolved in global climate models, predictions of how stratocumulus decks respond to greenhouse warming have remained uncertain[40]. To overcome this resolution barrier, Tapio Schneider, Colleen Kaul, and Kyle Pressel of the California Institute of Technology conducted a study published in Nature Geoscience in 2019[40]. The researchers utilized Large-Eddy Simulations that explicitly resolved cloud-scale turbulent dynamics across a representative 3-by-3-kilometer patch of the subtropical ocean coupled to a global climate framework[40].
Their simulations identified a physical tipping point governed by two interacting thermodynamic processes as greenhouse gas concentrations rise[40]. First, rising concentrations of carbon dioxide and the accompanying increase in atmospheric water vapor increase the longwave infrared opacity of the free troposphere above the cloud deck, which weakens the net upward longwave radiative cooling at the cloud tops until it becomes too weak to propel chilled air parcels down to the surface[40]. Second, greenhouse warming elevates sea surface temperatures and strengthens surface evaporation, intensifying the turbulent entrainment of warm, dry free-tropospheric air across the inversion interface[40].
Schneider, Kaul, and Pressel demonstrated that when atmospheric carbon dioxide concentrations rise above 1,200 parts per million—with complete breakup established in simulations at 1,300 parts per million—the stratocumulus decks become unstable and break up into scattered cumulus clouds within a century[40]. Because the dark subtropical ocean surface is exposed to direct sunlight by the loss of its reflective cloud shield, planetary albedo drops sharply[9]. In addition to the direct warming from rising carbon dioxide, this stratocumulus instability triggers an abrupt surface warming of about 8 kelvin (8 degrees Celsius) globally and 10 kelvin (10 degrees Celsius) in the subtropics, pushing the tropical atmospheric column toward a local runaway greenhouse state and altering maximum mean precipitation rates in hothouse climates[40]. Subsequent global cloud-locking experiments in 2025 under eight-times-carbon-dioxide control states using Gregory method regressions have further demonstrated that subtropical stratocumulus breakup alters the position of the Intertropical Convergence Zone, modifies nonlocal low-cloud distributions, and reshapes latitudinal and regional patterns of surface warming and extreme cold winter temperatures[46].
Crucially, the stratocumulus breakup exhibits strong hysteresis with respect to carbon dioxide forcing and large-scale subsidence[40]. Once the stratocumulus decks have broken up and the ocean surface has warmed, they do not re-form simply by reducing carbon dioxide back below 1,200 parts per million; rather, carbon dioxide concentrations must drop substantially below the level at which the instability first occurred before radiative cooling can re-establish the cloud deck[40]. While 1,200 parts per million is a high-emission threshold well above current atmospheric levels, commentators and researchers have noted that the regional low-cloud declines observed in 2023—and the abrupt climate transitions recorded in the geological past—reflect the operation of these same boundary-layer instability mechanisms[40].
Deep-Time Analogs: The Miocene Climatic Optimum and the Paleoclimate Paradox
High-Level Overview of the Cenozoic Model-Data Discrepancy
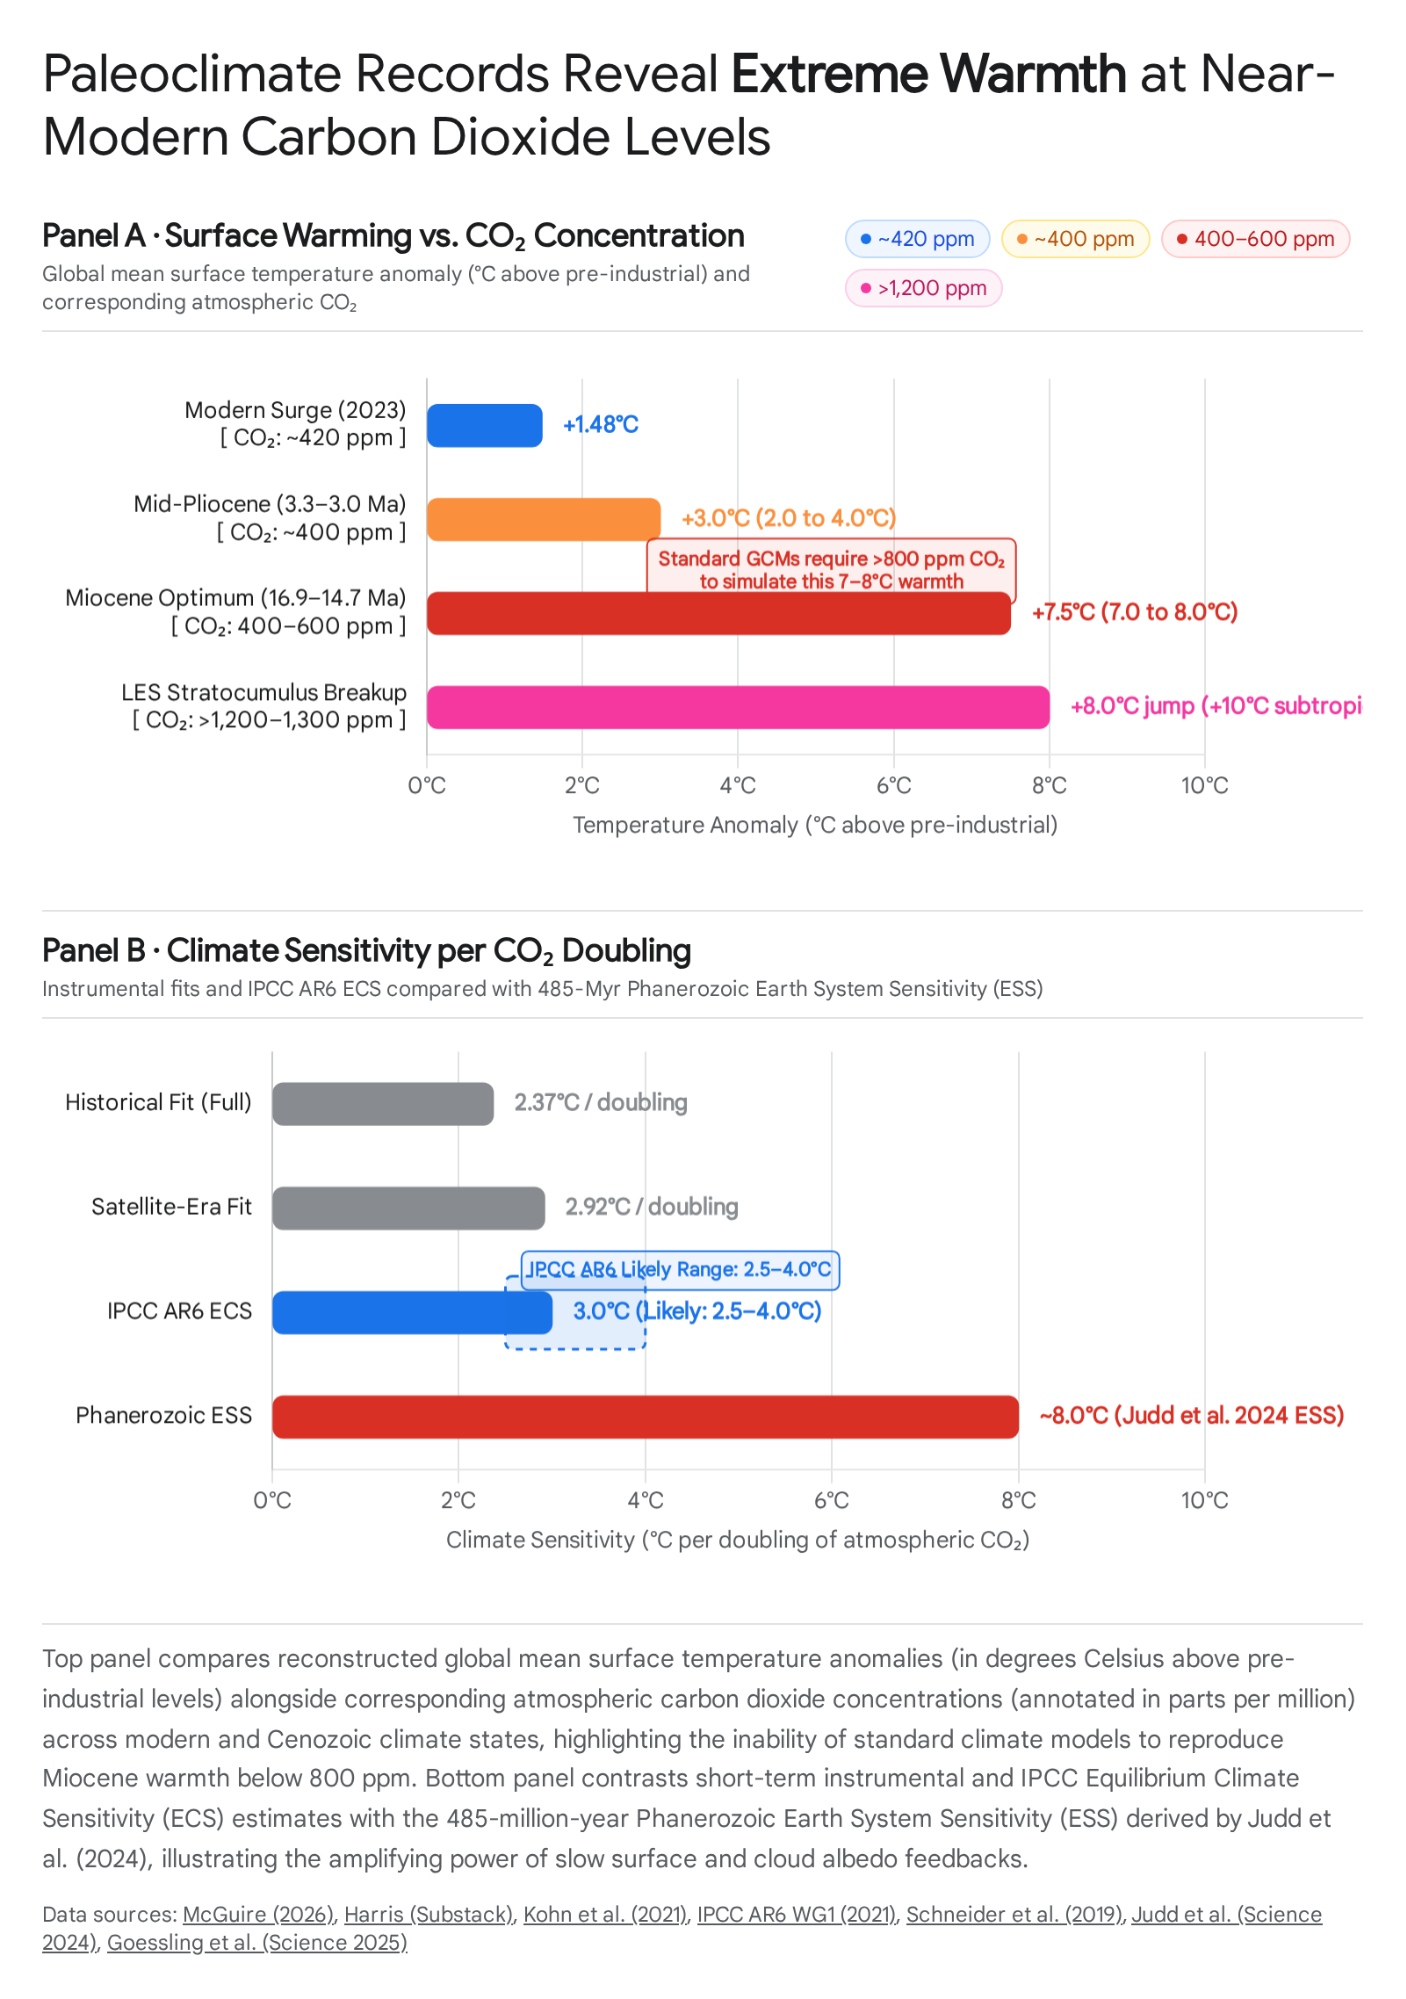
A key insight synthesized in Tom Harris's Poetic, Evocative, Dangerous: The Dark Side of Earth's Changing Clouds—and highlighted by geoscientist Professor Bill McGuire—is that modern satellite observations of shrinking cloud cover offer a physical explanation for a major discrepancy in paleoclimatology[4]. During past greenhouse intervals of the Cenozoic Era, most notably the Miocene Climatic Optimum (16.9 to 14.7 million years ago) and the Mid-Pliocene Warm Period (3.3 to 3.0 million years ago), Earth maintained global temperatures that were 2 to 8 degrees Celsius warmer than pre-industrial levels despite atmospheric carbon dioxide concentrations ranging between 400 and 600 parts per million[4]. Conventional climate models forced with these moderate carbon dioxide levels consistently fail to replicate such pervasive warmth[10]. Incorporating state-dependent cloud albedo reductions and altered cloud radiative forcing resolves this model-data mismatch, illustrating why long-term Earth System Sensitivity across the geological record is more than double the fast-feedback Equilibrium Climate Sensitivity used in standard policy projections[50].
Specific Scientific Details of Pliocene, Miocene, and Phanerozoic Reconstructions
To evaluate the predictive accuracy of numerical climate models under elevated carbon dioxide conditions, paleoclimatologists investigate pre-Quaternary warm intervals where continental configurations, mountain topography, and biotic taxa approached modern boundary conditions[10]. While the Early Eocene Climatic Optimum (examined in the DeepMIP model intercomparison) provides insights into hothouse physics, its different continental positions, absence of polar ice sheets, and distinct flora and fauna make it an imperfect future analog[10]. Consequently, research has focused on two chronologically closer Neogene intervals: the Mid-Pliocene Warm Period (MPWP, 3.3 to 3.0 million years ago, within the broader Pliocene Epoch from 5.2 to 2.6 million years ago) and the Miocene Epoch (23.03 to 5.33 million years ago), particularly the Miocene Climatic Optimum (MCO, approximately 16.9 to 14.7 million years ago)[10].
During the Mid-Pliocene Warm Period—targeted by the US Geological Survey PRISM (Pliocene Research, Interpretation and Synoptic Mapping) project across marine isotope stages M2 through KM5 and the Pliocene Model Intercomparison Project (PlioMIP)—high-resolution alkenone paleobarometry and boron isotope records indicate that atmospheric carbon dioxide concentrations were relatively stable near 400 parts per million[10]. Although modern anthropogenic emissions have already surpassed this 400 parts per million Pliocene concentration (exceeding 416 parts per million at Mauna Loa earlier in the 2020s), the equilibrium climate of the Mid-Pliocene was 2 to 4 degrees Celsius warmer globally than the pre-industrial era, corresponding to the equilibrium warming expected under low-emission stabilization pathways such as Representative Concentration Pathway (RCP) 2.6, with Pliocene-like climates predicted to emerge as soon as 2030[10].
Even more instructive for intermediate-to-high emission trajectories is the Miocene Climatic Optimum, a roughly two-million-year greenhouse interval bracketed by earlier Oligocene/Early Miocene glaciations and the subsequent abrupt cooling and Antarctic ice-sheet expansion of the Middle Miocene Climate Transition (MMCT, 14.7 to 13.8 million years ago, or circa 13.95 to 12.8 million years ago in North Pacific records)[10]. Following a stepwise warming trend documented in Central European megafloras during the Early Aquitanian, the onset of the MCO coincided with the 17 to 16 million-year-old Columbia River Basalt flood eruptions in western North America, combined with increased carbon dioxide fluxes from volcanic arc and rift activity and decreased continental silicate weatherability[47].
Paleobotanical and geochemical proxy reconstructions—including oxygen and carbon isotopes in deep-sea benthic foraminifera, magnesium-to-calcium ratios in foraminiferal calcite (which require careful adjustment for past seawater magnesium-to-calcium variations), leaf margin analysis (where warmer climates yield a higher proportion of smooth-edged leaves relative to serrated leaves), nearest-living-relative climatic coexistence envelopes, and fossil ectothermic vertebrates and herpetological assemblages across Central Europe—demonstrate that the broader Miocene was 3 to 7 degrees Celsius warmer than today (matching emissions scenarios such as RCP 4.5 to RCP 6.0), while the Miocene Climatic Optimum itself was 7 to 8 degrees Celsius warmer globally than the modern pre-industrial world, with proxy sea surface temperature reconstructions indicating a global mean surface temperature near 25 degrees Celsius[4]. Continental-sized ice sheets were absent from the Northern Hemisphere and reduced to a minimal volume on Antarctica, where evolving bedrock topography and vegetation-climate feedbacks linked deep ocean temperatures primarily to Antarctic ice-sheet extent rather than volume[10].
When geochemists reconstruct atmospheric carbon dioxide concentrations during the Middle Miocene and the MCO using leaf stomatal frequency indices, boron isotopes, and alkenone proxies, most records indicate sub-modern to moderately higher concentrations—broadly spanning 180 to 600 parts per million across the Middle Miocene and specifically 400 to 600 parts per million during the MCO, while the subsequent Middle Miocene Climate Transition cooling was associated with relatively small carbon dioxide variations of 50 to 125 parts per million[4].
This empirical evidence highlights a persistent limitation in standard General Circulation Models[10]. As documented in the Miocene Model Intercomparison Project (MioMIP1) ensemble by Burls and colleagues (2021), hydrological comparisons by Acosta and colleagues (2023), and earlier Community Earth System Model (CESM1) experiments by Goldner and colleagues (2014), no standard Miocene climate model simulation has reproduced the 7 to 8 degrees Celsius global warmth or the 25 degrees Celsius mean surface temperature of the MCO at reconstructed carbon dioxide concentrations below 800 parts per million[10]. In MioMIP1 simulations grouped into carbon dioxide tiers of 280, 400, 560, and 850 parts per million, all simulations with moderately high carbon dioxide concentrations (less than 560 parts per million) produced sea-surface-temperature-derived global mean temperatures that were substantially too cold compared to proxy reconstructions, requiring 800 to 850 parts per million to approach Miocene warmth[10].
| Climate Regime or Geological Interval | Chronological Age or Timeframe | Atmospheric Carbon Dioxide (ppm) | Global Mean Temperature Anomaly (degrees Celsius vs. Pre-Industrial) | Polar Cryosphere and Sea-Surface Gradient State | Hydrological Regime and Cloud or Model Behavior |
|---|---|---|---|---|---|
| Pre-Industrial Baseline | 1750 to 1850 CE | 280 ppm | 0.0 degrees Celsius (Reference) | Bipolar ice sheets; strong meridional and Pacific zonal SST gradients | Baseline storm tracks; all-sky planetary albedo 0.291[11] |
| Modern Anthropogenic Anomaly | 2023 to 2026 CE | 416 to greater than 425 ppm | +1.48 degrees Celsius (2023) to 1.5 degrees Celsius | Rapid Arctic sea-ice and snow pack loss; permafrost warming greater than 1 meter depth | Record-low albedo since 1940; -4.0 percent relative low-cloud loss in 2023[7] |
| Mid-Pliocene Warm Period (MPWP) | 3.3 to 3.0 Million Years Ago | 400 ppm | +2.0 to +4.0 degrees Celsius | Reduced Antarctic ice; absent or minimal Northern Hemisphere ice; weak SST gradients | Permanent El Niño-like state; wet subtropics; models require cloud albedo modification[10] |
| Miocene Climatic Optimum (MCO) | 16.9 to 14.7 Million Years Ago | 400 to 600 ppm | +7.0 to +8.0 degrees Celsius (GMST 25 degrees Celsius) | Minimal Antarctic ice; ice-free Northern Hemisphere; highly equable gradients | Global rainfall +2.1 to 2.3 percent per degree Celsius; wet subtropics; GCMs fail below 800 ppm without cloud loss[4] |
| LES Stratocumulus Breakup State | Future High-Emission or Hothouse Analog | Greater than 1,200 to 1,300 ppm | +8.0 degrees Celsius jump (+10.0 degrees Celsius in subtropics) | Complete loss of polar cryosphere; local runaway greenhouse column | Abrupt evaporation of subtropical stratocumulus into cumulus; strong hysteresis[40] |
| Phanerozoic Warm Greenhouse | 485-Million-Year Assimilation (Judd et al.) | Up to 4,800 ppm in hyperthermals | GMST 24.0 to 30.0 degrees Celsius (+10 to +16 degrees Celsius) | Completely free of polar and alpine ice sheets | Apparent Earth System Sensitivity (ESS) of 8.0 degrees Celsius per carbon dioxide doubling[53] |
As Tom Harris emphasizes in Poetic, Evocative, Dangerous, and as demonstrated in paleoclimate modeling by Natalie Burls and Alexey Fedorov (2014, 2017) and Tapio Schneider and colleagues (2019), the explanation for how the Miocene and Pliocene achieved such warmth at 400 to 600 parts per million carbon dioxide lies in the sensitivity of cloud radiative forcing and cloud albedo[4]. During both the Pliocene and the Miocene, proxy records reveal not only higher global mean temperatures, but also markedly weakened meridional (equator-to-pole) and zonal (east-to-west equatorial Pacific) sea surface temperature gradients, resulting in polar-amplified warmth and a permanent El Niño-like ocean state[51]. In the modern climate, cold upwelling waters in the eastern equatorial Pacific and subtropics sustain reflective marine stratocumulus decks that cool the subtropics and maintain a steep temperature gradient[34].
Burls and Fedorov demonstrated that standard climate models fail to simulate Pliocene, Miocene, and Eocene warmth at realistic carbon dioxide levels because their parameterized cloud radiative forcing is insufficiently sensitive to carbon dioxide and surface warming; attempting to reduce the meridional sea surface temperature gradient in a standard model solely by raising carbon dioxide requires concentrations far above 400 parts per million and causes the tropical warm pool and global mean temperatures to overheat[51]. When Burls and Fedorov drove a coupled ocean-atmosphere model with modified cloud radiative properties—specifically reducing low-cloud albedo in the subtropics and altering high-latitude cloud forcing—the model reproduced the weak meridional and zonal sea surface temperature gradients, subsurface ocean temperatures, and global warmth of the early Pliocene without requiring excessive carbon dioxide levels[51]. Similarly, Schneider and colleagues noted that during the Pliocene at 400 parts per million carbon dioxide, the climate system may have been cooling from the warmer, largely cloudless period of the Miocene, with boundary-layer hysteresis preventing stratocumulus clouds from re-forming until late Pliocene cooling crossed a lower temperature threshold[40]. Furthermore, Earth System Models that quantify the cloud particle-size feedback show that enhanced shortwave absorption triggers a seasonally runaway sea-ice surface albedo feedback, producing a September sea-ice-free Arctic Ocean and strongly amplified northern high-latitude warmth[54].
This cloud-mediated reduction in planetary temperature gradients also resolves a major paradox regarding the paleoclimatic hydrological cycle[49]. According to the thermodynamic Clausius-Clapeyron relation, a warmer atmosphere holds more water vapor[15]. When conventional climate models are forced with a quadrupling of carbon dioxide, they exhibit relatively uniform warming across latitudes that preserves a steep meridional temperature gradient; consequently, atmospheric moisture transport intensifies existing circulation patterns, producing the standard "dry gets drier, wet gets wetter" response in which the subtropics become progressively more arid[51].
In contrast, paleobotanical and geological reconstructions from the Miocene and Pliocene (including BIOME4 vegetation modeling and fossil plant data) demonstrate that the subtropics were substantially wetter than today, supporting expanded temperate and subtropical forests, bidirectional European precipitation changes recorded in herpetological fossils and Alpine oxygen-18 isotopes (which shifted by up to 2 per mil at high elevations and 1 per mil at low elevations in Middle Miocene COSMOS 450 parts per million simulations), and an intensified South American monsoon across the southern Central Andes[49]. Only later, as the global climate cooled from the late Miocene into the Pliocene and Pleistocene and meridional temperature gradients steepened, did subtropical aridification and fire regimes drive the expansion of C4 grasslands[51]. Burls and Fedorov (2017) demonstrated that when cloud albedo modifications weaken the meridional sea surface temperature gradient between the tropics and subtropics, wind-driven poleward heat transport within the ocean subtropical cells declines and meridional moisture transport equatorward of 40 degrees North and South weakens[51]. This structural reduction in moisture divergence reverses the oceanic hydrological response into a "dry gets wetter, wet gets drier" pattern and makes both the subtropics and tropics wetter over land—aligning with MioMIP1 multi-model findings that global Miocene rainfall increased by 2.1 to 2.3 percent per degree Celsius of warming[49].
The long-term implication of these Cenozoic analogs was quantified in September 2024 by Emily Judd, Jessica Tierney, Paul Valdes, and colleagues in Science (A 485-million-year history of Earth's surface temperature)[53]. By integrating the PhanTASTIC (Phanerozoic Technique Averaged Surface Temperature Integrated Curve) proxy database with climate model data assimilation across the past 485 million years, Judd and colleagues reconstructed Earth's oscillations between Icehouse states (characterized by polar ice and orbital glacial-interglacial cycles), Cool Greenhouse states (displaying some polar ice and alpine glaciers with global mean temperatures between 21 and 24 degrees Celsius), and Warm Greenhouse states (lacking any polar ice with global mean temperatures between 24 and 30 degrees Celsius, punctuated by hyperthermals where carbon dioxide exceeded 16 times pre-industrial levels, or 4,800 parts per million by volume)[57]. Whereas earlier Cenozoic syntheses by Hansen and colleagues and PALAEOSENS estimated fast-feedback sensitivity near 3 degrees Celsius per carbon dioxide doubling[12], Judd and colleagues found that across the entire 485-million-year Phanerozoic record, atmospheric carbon dioxide exerted the dominant control on global mean surface temperature with an apparent Earth System Sensitivity (ESS) of approximately 8 degrees Celsius per doubling of carbon dioxide[53]. As Tom Harris notes in his examinations of the Judd Cenozoic regression and Pleistocene noble-gas ocean temperature records[9], while short-term Equilibrium Climate Sensitivity (ECS) is assessed at 3 degrees Celsius based on fast feedbacks, long-term Earth System Sensitivity approaches 8 degrees Celsius because slow feedbacks—including ice-sheet loss, vegetation shifts, and nonlinear cloud albedo reductions that expose dark ocean and land surfaces—progressively amplify warming as the climate transitions toward a greenhouse state[9].
Cascading Earth System Implications and the Policy Horizon
High-Level Overview of System-Level Cascades
When the empirical observations of declining cloud cover in the CERES satellite record are integrated with the paleoclimatic evidence of the Miocene and Pliocene, the projected timeline of twenty-first-century climate change compresses noticeably[6]. Across his interconnected series of analyses on Climate Uncovered, Tom Harris examines the second- and third-order consequences of this radiative acceleration: a shortening of decadal warming intervals that makes passing the 2 degrees Celsius threshold in the second half of the 2030s very likely, an elevated risk of triggering decadal oceanic circulation shifts and terrestrial carbon-sink inversions, and a challenging confrontation with the physical and economic constraints of carbon dioxide removal and solar radiation management[5].
Acceleration of Warming Velocity and the 2030s Horizon
The immediate consequence of a declining planetary albedo is an acceleration in the pace of surface warming[5]. In Dimming Down, Harris evaluates the combined trajectory of greenhouse gas forcing and CERES-observed albedo decline, concluding that passing 2 degrees Celsius of warming above pre-industrial levels during the second half of the 2030s is very likely[15]. Statistical evaluations of ERA5 temperature records using 30-year LOESS smoothing trends indicate that the most recent 0.1 degree Celsius increments of global warming have each taken roughly three years; reaching 2 degrees Celsius in the late 2030s implies a warming rate approaching 0.1 degrees Celsius roughly every two years, an increase rapid enough to overwhelm most of the noise from natural interannual variability[15].
In his analysis The Velocity Hazard, Harris emphasizes that this warming rate is more critical to ecological and societal stability than absolute temperature thresholds such as 1.5 or 2.0 degrees Celsius considered in isolation[6]. Both biological ecosystems and human infrastructure require time to adapt; when shortwave cloud feedbacks accelerate impacts that were not expected under earlier IPCC assessments until mid-century into the present decade, adaptive capacity is strained across every continent[6]. Furthermore, as Watanabe and colleagues (2025) note, if the elevated trend in Earth's Energy Imbalance is maintained, natural fluctuations such as El Niño-Southern Oscillation cycles will increasingly produce amplified climate extremes, with the 2023 to 2024 period serving as an early indication of future conditions[17].
Marine Biogeochemical Loops and North Atlantic Circulation
Having absorbed the vast majority of Earth's Energy Imbalance, global oceans reached record heat levels between 2023 and 2026[15]. In A Transforming Ocean, which synthesizes key takeaways and a ten-year outlook from Ocean State Report 10, Harris notes that over the last decade, ocean warming and acidification have transitioned from long-term projections into active, disruptive forces reshaping marine ecosystems, weather systems, and marine economies (while other research explores whether coral reefs have already crossed Earth's first climate tipping point)[6]. Crucially, coastal marine forests bury carbon more than ten times faster per hectare than terrestrial forests, while marine phytoplankton produce biogenic sulfur compounds that seed low-level marine clouds[63]. When enhanced shortwave absorption warms and stratifies the upper ocean, marine heatwaves exacerbate impacts on fisheries and nutrient supply, degrading both carbon burial in marine forests and the biogenic plankton emissions that feed low clouds—establishing a reinforcing biogeochemical-albedo feedback loop[25].
Simultaneously, in the North Atlantic—where Goessling and colleagues documented pronounced decadal reductions in low-cloud cover[14]—Harris highlights an immediate oceanic tipping element in The Engine in the Shadow: the North Atlantic Subpolar Gyre (SPG)[6]. While scientific and public attention frequently focuses on a potential collapse of the Atlantic Meridional Overturning Circulation (AMOC), the Subpolar Gyre operates on a faster, decadal timescale[6]. Modeling indicates that a Subpolar Gyre convective shutdown could occur by the 2040s—decades before a full AMOC collapse—triggering severe European weather shifts and oceanic cascades[6]. Furthermore, paleoclimatic and modeling studies by Chiang and colleagues and Kang and colleagues demonstrate that hemispheric asymmetries in albedo, surface temperature, and clouds strongly govern the latitudinal position of the Intertropical Convergence Zone and Sahelian hydrological variability[52].
Cryospheric Amplification and the Carbon Inversion Hazard
At present, approximately half of the carbon dioxide that humanity emits into the atmosphere each year is recaptured at no economic cost by the Earth's biological and chemical systems[6]. Standard warming projections rely on this natural sink subsidy continuing; however, in The Inversion Hazard (and his October 2026 MEERTalk presentation The Inversion Trap), Harris examines how warming beyond 2 degrees Celsius threatens to transform these carbon sinks into net carbon sources, driving warming upward even after human emissions are brought down to zero[6].
A primary locus of this inversion is the Arctic cryosphere[7]. As Arctic Amplification pushes high-latitude surface air warming past 1.15 degrees Celsius per decade, winter snow levels and snowpack duration are declining rapidly, altering the thermal relationship between air and soil temperatures[7]. A 27-year observational study in Alaska demonstrates that permafrost warming has penetrated deeper than 1 meter across 100 percent of measurement sites, threatening to mobilize vast stores of frozen organic carbon[7]. Across lower latitudes, nature-based terrestrial sinks such as agroforestry and forest restoration help buffer emissions, but wildfires, floods, and ecosystem maturation cap their longevity and scale as the background climate warms[7].
The Overshoot Trap and Solar Geoengineering Dilemmas
Because positive cloud feedbacks and carbon sink inversions accelerate warming toward 2 degrees Celsius in the 2030s, international climate policy increasingly relies on scenarios involving temperature overshoot—exceeding targets temporarily and subsequently cooling the planet via large-scale Carbon Dioxide Removal (CDR)[6]. In The Overshoot Trap: The Unforgiving Physics and Economics of Carbon Removal, Harris details the physical and economic constraints of this strategy: recovering from overshoot requires scrubbing approximately 1,000 gigatons of carbon dioxide from the atmosphere[6]. Because nature-based sinks face saturation and disturbance limits, mechanical Direct Air Capture (DAC) requires mass-manufactured industrial modules co-located at sites possessing both abundant clean energy and immediate geological access to reactive basalt formations or saline aquifers for permanent storage—representing an immense industrial and thermodynamic scaling challenge rather than a rapid fix[6].
| Earth System or Policy Domain | Specific Mechanism or Tipping Element | Quantitative Metric or Threshold | System-Level Cascade and Policy Implication |
|---|---|---|---|
| Warming Velocity and 2 Degrees Celsius Horizon | Shortwave albedo decline plus GHG forcing (Dimming Down and Velocity Hazard) | 0.1 degrees Celsius per 2 to 3 years; 2.0 degrees Celsius crossed in late 2030s | Rate of warming overwhelms natural variability and outpaces biological and infrastructural adaptation[6] |
| North Atlantic Circulation | Subpolar Gyre (SPG) Convection (The Engine in the Shadow) | Decadal timescale; potential shutdown by the 2040s | Triggers severe European weather shifts and marine cascades decades ahead of full AMOC collapse[6] |
| Marine Biogeochemical Loop | Marine forests and phytoplankton cloud seeding (A Transforming Ocean) | Marine forests bury carbon greater than 10 times faster per hectare than land | Ocean warming and acidification degrade carbon burial and reduce biogenic plankton aerosols that feed low clouds[6] |
| Terrestrial and Cryospheric Sinks | Permafrost thaw and sink saturation (The Inversion Hazard) | Arctic warming greater than 1.15 degrees Celsius per decade; Alaska permafrost warming greater than 1 meter at 100 percent of sites | Natural sinks (currently absorbing 50 percent of human carbon dioxide emissions) invert into net sources beyond 2.0 degrees Celsius[6] |
| Carbon Dioxide Removal (CDR) | Mechanical Direct Air Capture and storage (The Overshoot Trap) | 1,000 gigatons of carbon dioxide removal required for overshoot recovery | Constrained by thermodynamic energy limits, module manufacturing scale, and basalt or saline aquifer co-location[6] |
| Solar Geoengineering (SRM) | Stratospheric Aerosol Injection (SAI) and Marine Cloud Brightening (MCB) | Offsetting +1.7 to +2.0 watts per square meter albedo loss | Attempts to artificially restore lost shortwave reflectivity; carries termination shock and boundary-layer risks[5] |
Finally, the recognition that Earth is darkening due to declining cloud reflectivity has placed Solar Radiation Management (SRM)—such as Stratospheric Aerosol Injection (SAI) and Marine Cloud Brightening (MCB)—at the center of climate intervention discussions[5]. Proponents of solar geoengineering argue that because aerosol unmasking and low-cloud feedbacks are accelerating shortwave absorption, intentionally introducing reflective aerosols to brighten marine clouds or the stratosphere offers a fast-acting mechanism to limit near-term warming and protect food security while carbon capture and renewable energy systems scale[7].
However, as noted by both Schneider and colleagues (2019) and Harris (2026), solar geoengineering does not remediate ocean acidification or the underlying accumulation of greenhouse gases[5]. Furthermore, Schneider's Large-Eddy Simulations demonstrate a critical physical vulnerability: even if solar geoengineering artificially masks surface warming by reflecting sunlight in the stratosphere, continuing to emit carbon dioxide still increases the longwave infrared opacity of the atmosphere[40]. Consequently, elevated carbon dioxide concentrations under a geoengineered sky can still weaken cloud-top longwave radiative cooling enough to trigger the breakup of subtropical stratocumulus decks—or produce a rapid termination shock if geoengineering operations are ever interrupted after atmospheric carbon dioxide has crossed the cloud-instability threshold[40].
Conclusion
The synthesis of modern satellite radiometry, boundary-layer fluid dynamics, and Cenozoic paleoclimatology presented in Poetic, Evocative, Dangerous: The Dark Side of Earth's Changing Clouds and the broader scientific literature reflects an important advance in Earth system science[4]. For decades, the protective cover of marine stratocumulus and low-level cloud decks—which blankets two-thirds of the globe and nearly doubles planetary albedo from 0.154 to 0.291—was frequently regarded in broader discourse as a relatively stable backdrop to the longwave greenhouse effect[5]. More than two decades of CERES satellite observations and ERA5 vertical reanalyses have revised that assumption[2]. The documented contraction of low-level cloud cover—reaching a 4.0 percent relative deficit in 2023—has reduced planetary albedo to its lowest level since at least 1940, adding nearly 2 watts per square meter of absorbed shortwave solar energy into the climate system, doubling Earth's Energy Imbalance, and driving global surface temperatures to 1.48 kelvin above pre-industrial baselines[8].
While reductions in anthropogenic sulfate aerosols from clean-air policies and shipping regulations have contributed regionally to this clearing of the skies, microphysical buffering and global energy-budget constraints confirm that the overarching trajectory is governed by a positive, warming-driven cloud feedback[4]. This contemporary observational signal bridges directly to the geological record of the Miocene Climatic Optimum and the Mid-Pliocene Warm Period, explaining how an Earth with near-modern continental geometry and moderate carbon dioxide concentrations of 400 to 600 parts per million sustained global temperatures 2 to 8 degrees Celsius warmer than pre-industrial baselines—and why Phanerozoic Earth System Sensitivity approaches 8 degrees Celsius per carbon dioxide doubling[4]. Because retreating clouds accelerate the rate of warming toward 2 degrees Celsius in the late 2030s and threaten to trigger North Atlantic Subpolar Gyre shifts and permafrost carbon inversions well before mechanical carbon removal can scale to gigaton capacities, preserving the stability of Earth's boundary-layer cloud shield requires rapid, structural reductions in fossil fuel emissions alongside integrated ecological and water-management resilience[1].
Works Cited
- Atticus Fox – PJ O'Rourke meets Bill Hicks, https://atticusfox.home.blog/
- Anthropogenic forcing and response yield observed positive trend in, https://pmc.ncbi.nlm.nih.gov/articles/PMC8319337/
- The changing nature of Earth's reflected sunlight | Proceedings A, https://royalsocietypublishing.org/rspa/article/478/2263/20220053/56646/The-changing-nature-of-Earth-s-reflected
- Post by @profbillmcguire.bsky.social — Bluesky, https://bsky.app/profile/profbillmcguire.bsky.social/post/3myesr3feik2k
- Dimming Down - How Albedo decline is accelerating warming and, https://drtomharris.substack.com/p/dimming-down-how-albedo-decline-is
- Climate Uncovered | Tom Harris | Substack, https://drtomharris.substack.com/
- Dr Tom Harris (@drtomharris.bsky.social) — Bluesky, https://bsky.app/profile/drtomharris.bsky.social
- (PDF) Are Aerosol and Effective Radiative Forcing Overestimated in, https://www.researchgate.net/publication/399240897_Are_Aerosol_and_Effective_Radiative_Forcing_Overestimated_in_AR6_Evidence_from_Two_Independent_Climate_Observations_with_SAI_Implications
- Anthropogenic Climate Sensitivity: Reframing Earth's Response in, https://drtomharris.substack.com/p/anthropogenic-climate-sensitivity
- The Miocene: The Future of the Past - ScholarWorks, https://scholarworks.boisestate.edu/context/geo_facpubs/article/1597/viewcontent/Kohn__Matthew__2021__The_miocene___PUB.pdf
- Remote sensing of earth's energy budget: synthesis and review, https://www.tandfonline.com/doi/full/10.1080/17538947.2019.1597189
- sea distributions and global surface albedo since the Cretaceous, https://academiccommons.columbia.edu/doi/10.7916/d8-a29q-zh63/download
- The 3 levers that could stabilise the climate - Climate Uncovered, https://drtomharris.substack.com/p/the-3-levers-that-could-stabilise
- Recent global temperature surge intensified by record-low planetary, https://epic.awi.de/59831/1/adq7280_Merged_AcceptedVersion_v20241206.pdf
- 22d - Post by @climatecasino.net — Bluesky, https://bsky.app/profile/climatecasino.net/post/3mvn46f7z7222
- Global Warming & Clouds / Aerosols, https://www.eorc.jaxa.jp/EARTHCARE/about/gw_cloud_aerosol_e.html
- Dr. Norman Loeb - Nasa Ceres, https://ceres.larc.nasa.gov/people/dr-norman-loeb/
- CERESMIP: A climate modeling protocol to investigate recent trends, https://www.osti.gov/servlets/purl/1993548
- Post by @climatecasino.net — Bluesky, https://bsky.app/profile/climatecasino.net/post/3ljskbhu34c2o
- Planetary albedo change exacerbates surface warming - ACP, https://acp.copernicus.org/articles/26/12591/2026/
- Recent global temperature surge amplified by record-low planetary, https://www.researchgate.net/publication/381006006_Recent_global_temperature_surge_amplified_by_record-low_planetary_albedo
- Norman LOEB | Science Directorate (Langley) | Research profile, https://www.researchgate.net/profile/Norman-Loeb
- Impact of reflected shortwave anisotropy on satellite radiometer, https://amt.copernicus.org/articles/19/1643/2026/
- CERESMIP: a climate modeling protocol to investigate recent trends, https://www.frontiersin.org/journals/climate/articles/10.3389/fclim.2023.1202161/full
- Recent global temperature surge intensified by record-low planetary, https://www.researchgate.net/publication/386465328_Recent_global_temperature_surge_intensified_by_record-low_planetary_albedo
- Scientists Discover Explanation for the Unusually Sudden, https://scitechdaily.com/scientists-discover-explanation-for-the-unusually-sudden-temperature-rise-in-2023/
- Recent global temperature surge intensified by record-low planetary, https://pubmed.ncbi.nlm.nih.gov/39636934/
- Low-level clouds play surprise role in global warming, https://www.astronomy.com/science/low-level-clouds-play-surprise-role-in-global-warming/
- Recent Advances in the Observation and Modeling of Aerosol-Cloud, https://pmc.ncbi.nlm.nih.gov/articles/PMC12361286/
- The Earth's Energy Budget, Climate Feedbacks and Climate Sensitivity, https://www.cambridge.org/core/services/aop-cambridge-core/content/view/AE57C97E588FF3060C7C7E47DD4F3C6E/9781009157889c7_923-1054.pdf
- Global Temperature Report for 2025 - Berkeley Earth, https://berkeleyearth.org/global-temperature-report-for-2025/
- Thierry Roncalli's - Lecture 9. Awareness of Climate Change Impacts, http://www.thierry-roncalli.com/download/HSF-Lecture9.pdf
- NASA Technical Memorandum 0000, https://ntrs.nasa.gov/api/citations/20250009667/downloads/GSFC_STG_2025_Cloud_Feedback_Vf_final.pdf
- Global Low Clouds Evolution and Their Meteorological Drivers, https://www.mdpi.com/2072-4292/17/24/4045
- TS Technical Summary - IPCC, https://www.ipcc.ch/report/ar6/wg1/downloads/report/IPCC_AR6_WGI_TS.pdf
- Climate Change 2021: The Physical Science Basis - IPCC, https://www.ipcc.ch/report/ar6/wg1/downloads/report/IPCC_AR6_WGI_SummaryVolume.pdf
- Sea ice pattern effect on Earth's energy budget is characterized by, https://pmc.ncbi.nlm.nih.gov/articles/PMC11870058/
- Chapter 7: The Earth's Energy Budget, Climate Feedbacks, and, https://www.ipcc.ch/report/ar6/wg1/chapter/chapter-7/
- Comments - The Inversion Hazard - When Carbon Sinks become, https://drtomharris.substack.com/p/the-inversion-hazard-when-carbon/comments
- Possible climate transitions from breakup of stratocumulus decks, https://www.researchgate.net/publication/331337101_Possible_climate_transitions_from_breakup_of_stratocumulus_decks_under_greenhouse_warming
- Potential breakup of marine stratocumulus clouds under, https://ocean2climate.org/2019/03/17/potential-breakup-of-marine-stratocumulus-clouds-under-greenhouse-warming-may-speed-up-ocean-warming/
- https://www.vliz.be/nl/catalogus?module=ref&refid=308737&printversion=1&dropIMIStitle=1
- The diurnal stratocumulus-to-cumulus transition over land in ... - ACP, https://acp.copernicus.org/articles/20/2735/2020/
- A World Without Clouds | Quanta Magazine, https://www.quantamagazine.org/cloud-loss-could-add-8-degrees-to-global-warming-20190225/
- Exploring subtropical stratocumulus multiple equilibria using ... - arXiv, https://arxiv.org/html/2207.07184v1
- Investigating the Effects of a Subtropical Stratocumulus Cloud, https://journals.ametsoc.org/view/journals/clim/38/17/JCLI-D-24-0371.1.xml
- Middle Miocene climate evolution in the Northern Mediterranean, https://egusphere.copernicus.org/preprints/2024/egusphere-2024-2093/egusphere-2024-2093.pdf
- (PDF) The Miocene: The Future of the Past - ResearchGate, https://www.researchgate.net/publication/347960864_The_Miocene_The_Future_of_the_Past
- A Model‐Data Comparison of the Hydrological Response to, https://nora.nerc.ac.uk/id/eprint/536626/1/Paleoceanog%20and%20Paleoclimatol%20-%202023%20-%20Acosta%20-%20A%20Model%E2%80%90Data%20Comparison%20of%20the%20Hydrological%20Response%20to%20Miocene%20Warmth%20.pdf
- The Puzzling Pleistocene - RealClimate, https://www.realclimate.org/index.php/archives/2026/03/the-puzzling-pleistocene/
- Wetter subtropics in a warmer world: Contrasting past and future, https://www.pnas.org/doi/pdf/10.1073/pnas.1703421114
- University of Bristol, https://www.bristol.ac.uk/media-library/sites/cabot---old/migrated/documents/pliocene-abstracts.pdf
- A 485-million-year history of Earth's surface temperature, https://www.researchgate.net/publication/384192624_A_485-million-year_history_of_Earth's_surface_temperature
- Simulating Miocene warmth: insights from an opportunistic Multi, https://www.researchgate.net/publication/348586497_Simulating_Miocene_warmth_insights_from_an_opportunistic_Multi-Model_ensemble_MioMIP1
- Long Simulations of the Miocene Climatic Optimum, https://par.nsf.gov/biblio/10687845
- Middle Miocene Climate and Stable Oxygen Isotopes in Europe, https://gfzpublic.gfz.de/rest/items/item_5013526_4/component/file_5013615/content
- A Song of Ice and Fire: 485-million-year history of Earth's surface, https://paleonerdish.wordpress.com/2024/09/27/a-song-of-ice-and-fire-485-million-year-history-of-earths-surface-temperature/
- The Strength of Low-Cloud Feedbacks and Tropical ... - AMS Journals, https://journals.ametsoc.org/downloadpdf/journals/clim/32/9/jcli-d-18-0551.1.pdf
- A new global biome reconstruction and data-model comparison for, https://www.researchgate.net/publication/313475137_A_new_global_biome_reconstruction_and_data-model_comparison_for_the_Middle_Pliocene
- A 485-million-year history of Earth's surface temperature, https://www.semanticscholar.org/paper/A-485-million-year-history-of-Earth%E2%80%99s-surface-Judd-Tierney/ab67578fb807060aebff87c93335a411fc15020b
- A 485-million-year history of Earth's surface temperature - PubMed, https://pubmed.ncbi.nlm.nih.gov/39298603/
- Over nearly half a billion years, Earth's global temperature has, https://www.sciencedaily.com/releases/2024/09/240919174739.htm
- Comments - A Transforming Ocean: Key Takeaways and a Ten-Year, https://open.substack.com/pub/drtomharris/p/a-transforming-ocean-key-takeaways?utm_source=post&comments=true&utm_medium=web
- 005 | The Hidden Cost of Cleaner Air? Earth System Warming, https://www.silverlining.ngo/paper-cuts/005
- Emerging hemispheric asymmetry of Earth's radiation - PNAS, https://www.pnas.org/doi/10.1073/pnas.2511595122